
1NASDAQ: JYNT | © 2026 The Joint Corp. All Rights Reserved. | Q3 2026 Financial Results As of September 30, 2026, reported on November 5, 2026
2NASDAQ: JYNT | © 2026 The Joint Corp. All Rights Reserved. | This presentation contains statements about future events and expectations that constitute forward-looking statements. Forward-looking statements are based on our beliefs, assumptions and expectations of industry trends, our future financial and operating performance and our growth plans, taking into account the information currently available to us. These statements are not statements of historical fact. Words such as "anticipates," "believes," "continues," "estimates," "e xpects," "goal," "objective," "intends," "may," "opportunity," "plans," "potential," "near-term," "long-term," "projections," "assumptions," "projects," "guidance," "forecasts," "outlook," "target," "trends," "should," "could," "would," "will," and similar expressions are intended to identify such forward-looking statements. Specific forward-looking statements made in this presentation include, among others, our belief that our efforts to reacquire the RD rights to five territories will lead to the realization of approximately $3.0 million in reduced RD royalties on an annualized basis, with approximately one-third of this benefit being offset by internal costs to manage these territories; our belief that our third quarter results reflect growth in our active membership count as well as in the LTV per active member; our belief that by leaning into our value proposition, including with our newer flexible membership options, we are d riving more members to stay with us longer; our belief that, primarily reflecting the ongoing macroeconomic challenges, growth in these metrics is partially offset by lower average patient spend per month and fewer new patients, which is continuing to impact our comps; our belief that our ability to grow our active membership count, combined with improving pati ent conversion and retention rates as well as our stronger new clinic performance, is [strengthening/establishing] our foundation for future growth; our belief that our success with our clinic refranchising efforts has positioned The Joint with a pure-play franchisor model, which, combined with RD territory buybacks already completed this year, is helping to drive margin improvement, profitability and growing cash flow; our belief that, with our strong balance sheet and improving cash generation from continuing operations, we have the financial flexibility to continue to execute simultaneously on our growth strategies, RD territory buybacks and continued share repurchase capital allocation priorities; our belief that our additional $5 million share repurchase authorization reflects our confidence that our asset-light franchise model and initiatives to reignite growth will help create long-term value for our stockholders; and our updated 2026 guidance for system-wide sales, system-wide comp sales, consolidated Adjusted EBITDA, existing franchised clinic closures, and overall clinic count. Forward-looking statements involve risks and uncertainties that may cause our actual results to differ materially from the expectations of future results we express or imply in any forward-looking statements, and you should not place undue reliance on such statements. Factors that could contribute to these differences include, but are not limited to, our inability to identify and recruit enough qualified chiropractors and other personnel to staff our clinics, due in part to the nationwide labor shortage and an increase in operating expenses due to measures we may need to take to address such shortage; inflation, leading to increased labor costs and interest rates, as well as changes to import tariffs and increased gas prices, may lead to reduced discretionary spending, all of which may negatively impact our business; our failure to profitably operate company-owned or managed clinics; our failure to refranchise as planned; short-selling strategies and negative opinions posted on the internet, which could drive down the market price of our common stock and result in class action lawsuits; our failure to remediate future material weaknesses in our internal control over financial reporting, which could negatively impact our ability to accurately report our financial resul ts, prevent fraud, or maintain investor confidence; and other factors described in our filings with the SEC, including in the section entitled “Risk Factors” in our Annual Report on Form 10-K for the year ended December 31, 2025 filed with the SEC on March 13, 2026 and subsequent filings with the SEC. We qualify any forward-looking statements entirely by these cautionary factors. We assume no obligation to update or revise any forward-looking statements for any reason or to update the reasons actual results could differ materially from those anticipated in these forward-looking statements, even if new information becomes available in the future. Comparisons of results for current and any prior periods are not intended to express any future trends or indications of future performance, unless expressed as such, and should only be viewed as historical data. The Joint Business Structure The Joint Corp. is a franchisor of clinics and an operator of clinics in certain states. In Arkansas, California, Colorado, Connecticut, Delaware, District of Columbia, Florida, Illinois, Kansas, Kentucky, Maryland, Michigan, Minnesota, New Jersey, New York, North Carolina, Oregon, Pennsylvania, Tennessee, Washington, and West Virginia, The Joint Corp. and its franchisees provide management services to affiliated professional chiropractic practices. Safe Harbor Statements

3NASDAQ: JYNT | © 2026 The Joint Corp. All Rights Reserved. | Sanjiv Razdan CEO, President and Director
4NASDAQ: JYNT | © 2026 The Joint Corp. All Rights Reserved. | A Capital-light, Pure-play Franchisor Strengthened patient engagement and our reshaped operating model helped drive revenue growth and stronger profitability from continuing operations o Growing active membership count and patient retention supported higher patient lifetime value o Comps negative primarily due to pressure on consumer spending, but improved quarter-over-quarter o Capital-light model driving revenue growth and stronger profitability
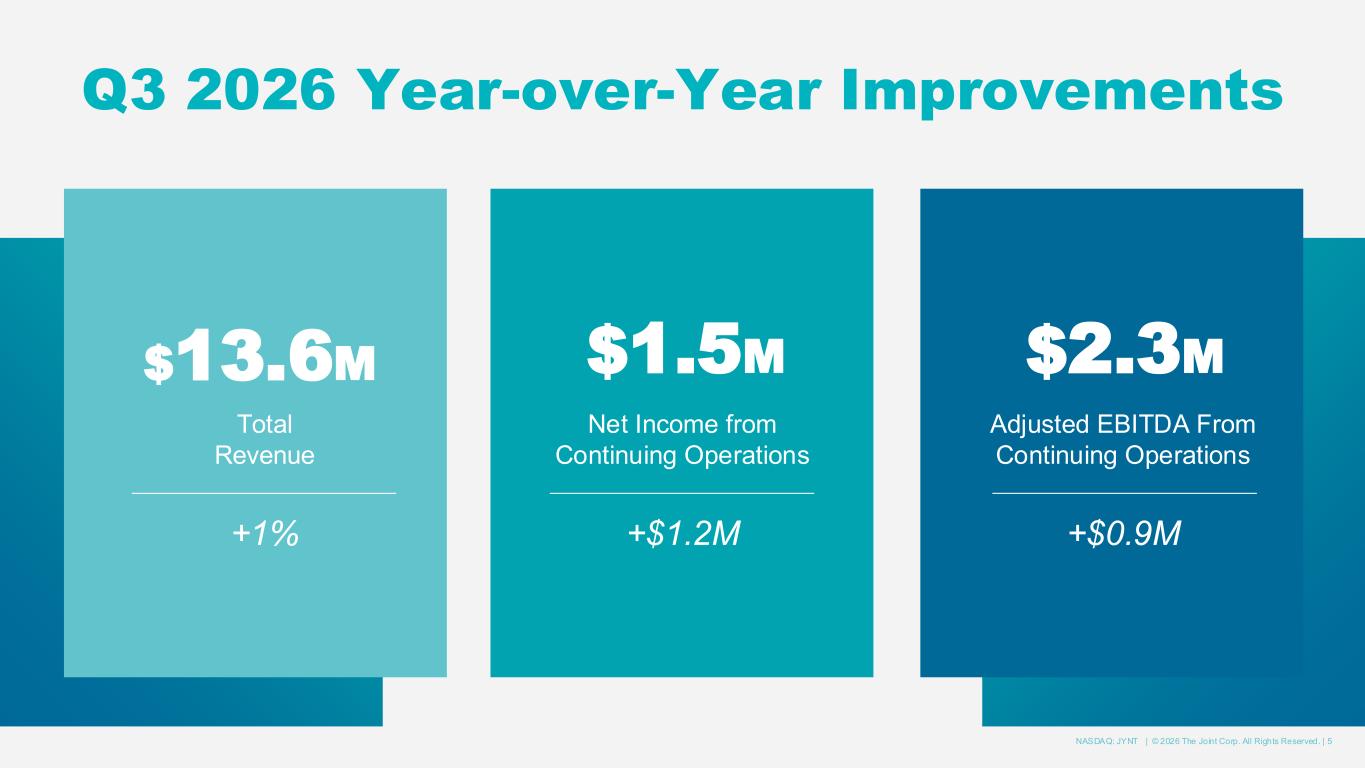
5NASDAQ: JYNT | © 2026 The Joint Corp. All Rights Reserved. | Q3 2026 Year-over-Year Improvements Adjusted EBITDA From Continuing Operations +$0.9M $2.3M$13.6M Total Revenue +1% $1.5M Net Income from Continuing Operations +$1.2M
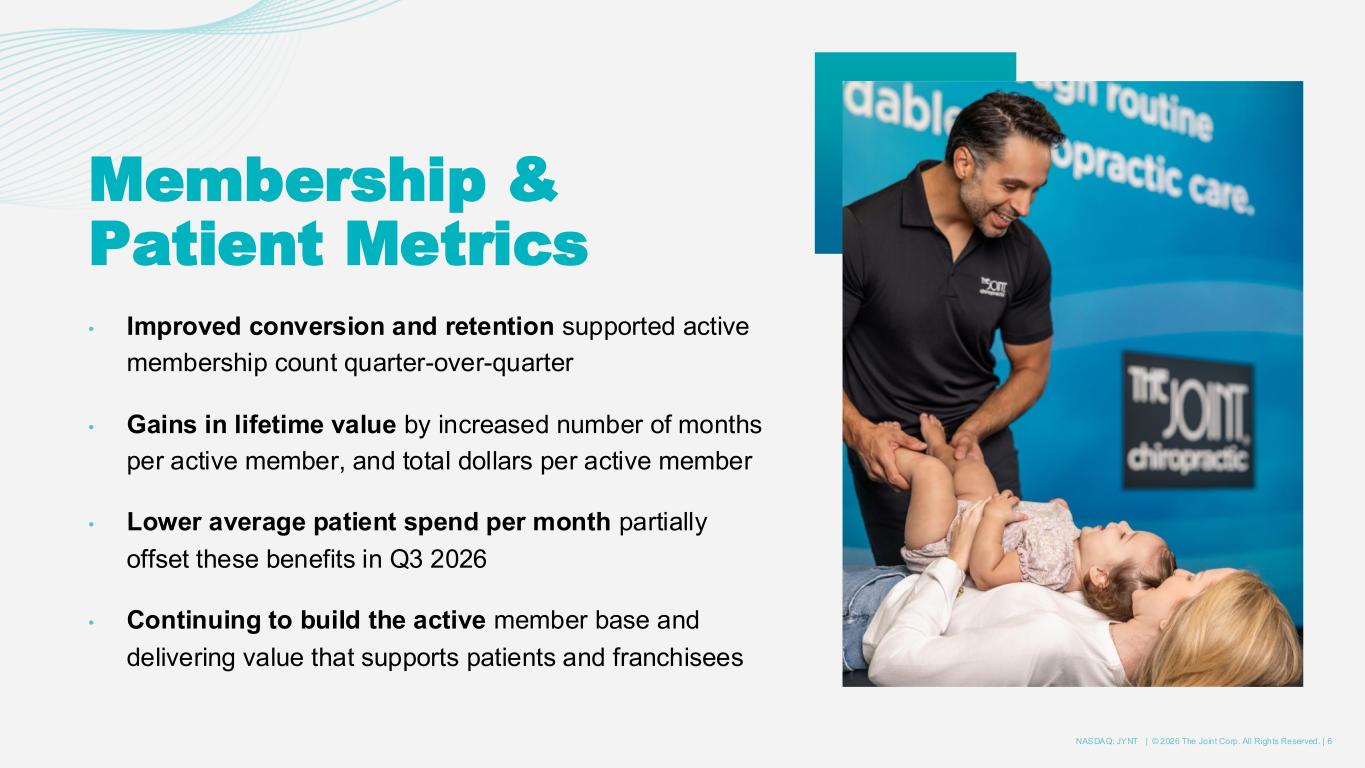
6NASDAQ: JYNT | © 2026 The Joint Corp. All Rights Reserved. | Membership & Patient Metrics • Improved conversion and retention supported active membership count quarter-over-quarter • Gains in lifetime value by increased number of months per active member, and total dollars per active member • Lower average patient spend per month partially offset these benefits in Q3 2026 • Continuing to build the active member base and delivering value that supports patients and franchisees
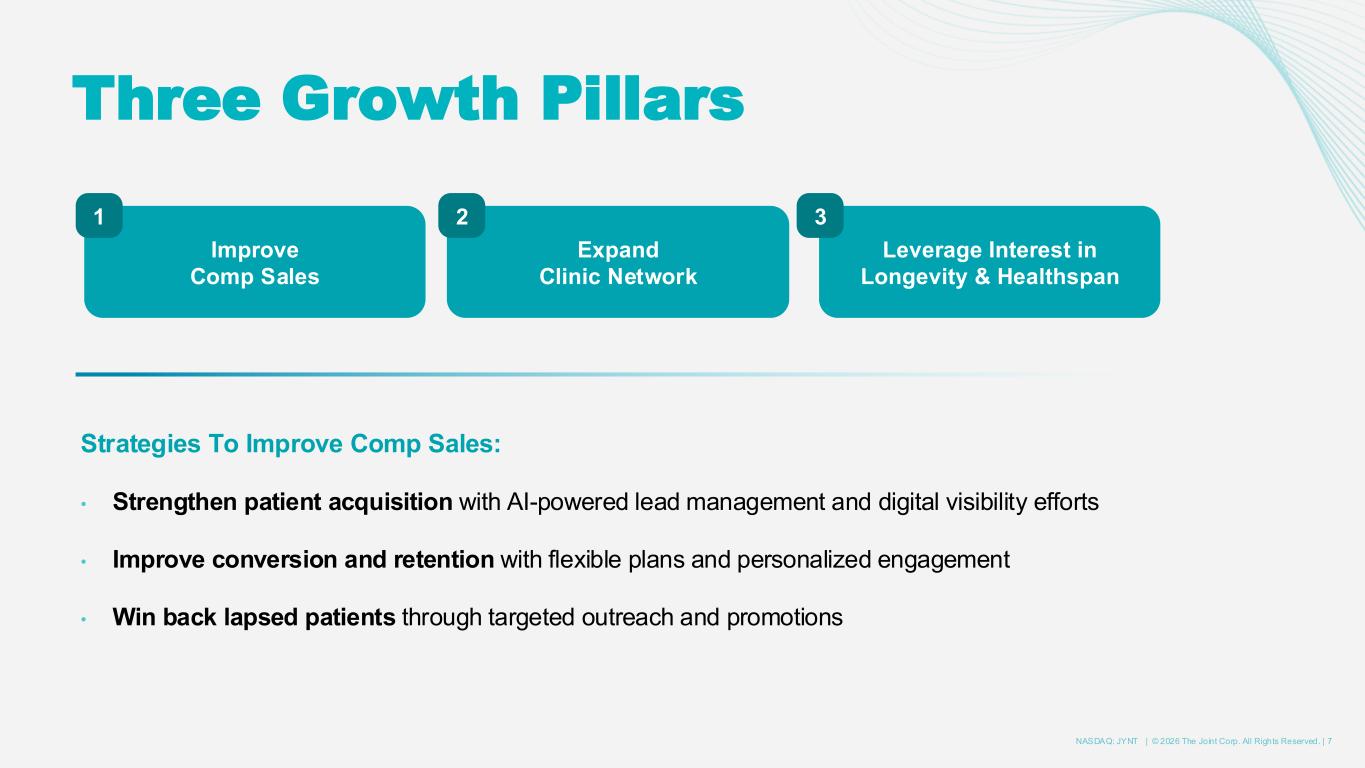
7NASDAQ: JYNT | © 2026 The Joint Corp. All Rights Reserved. | Three Growth Pillars Strategies To Improve Comp Sales: • Strengthen patient acquisition with AI-powered lead management and digital visibility efforts • Improve conversion and retention with flexible plans and personalized engagement • Win back lapsed patients through targeted outreach and promotions Improve Comp Sales Expand Clinic Network Leverage Interest in Longevity & Healthspan 1 2 3
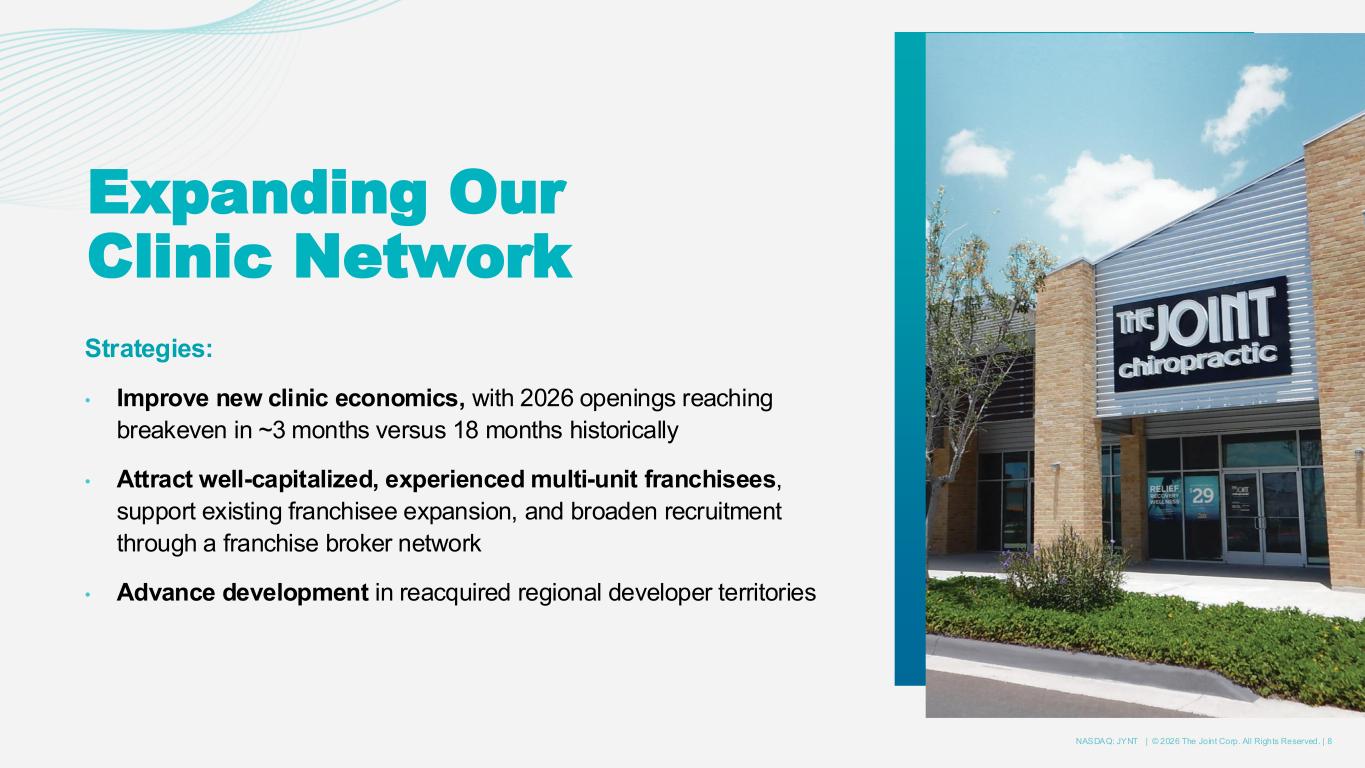
8NASDAQ: JYNT | © 2026 The Joint Corp. All Rights Reserved. | Strategies: • Improve new clinic economics, with 2026 openings reaching breakeven in ~3 months versus 18 months historically • Attract well-capitalized, experienced multi-unit franchisees, support existing franchisee expansion, and broaden recruitment through a franchise broker network • Advance development in reacquired regional developer territories Expanding Our Clinic Network

9NASDAQ: JYNT | © 2026 The Joint Corp. All Rights Reserved. | Growing Interest in Longevity & Healthspan Strategies: • Use consumer research to personalize the patient experience, emphasizing pain relief, improved mobility and longer-term engagement • Test proprietary clinical care protocols with measurable outcomes to demonstrate patient progress • Pilot complementary retail offerings, including orthotics and supplements
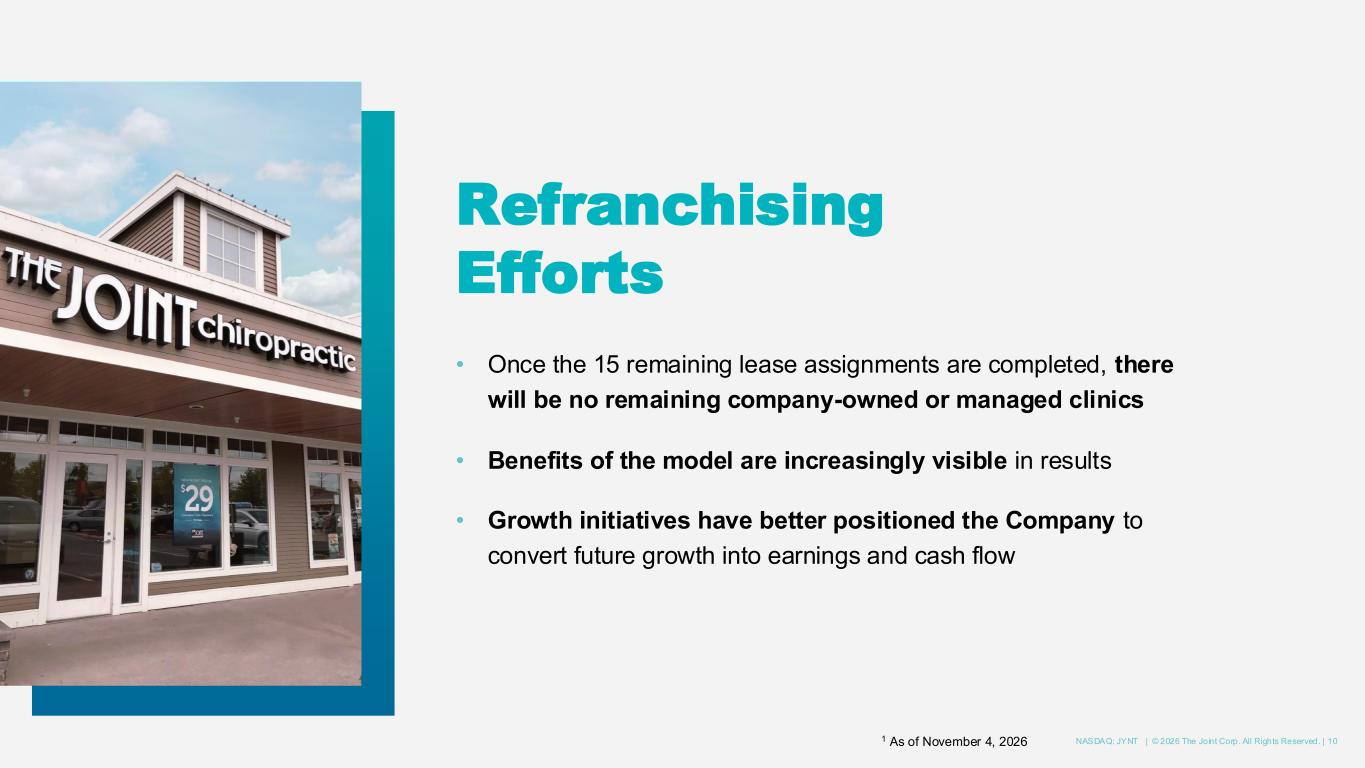
10NASDAQ: JYNT | © 2026 The Joint Corp. All Rights Reserved. | Refranchising Efforts • Once the 15 remaining lease assignments are completed, there will be no remaining company-owned or managed clinics • Benefits of the model are increasingly visible in results • Growth initiatives have better positioned the Company to convert future growth into earnings and cash flow 1 As of November 4, 2026
11NASDAQ: JYNT | © 2026 The Joint Corp. All Rights Reserved. | Scott Bowman Chief Financial Officer
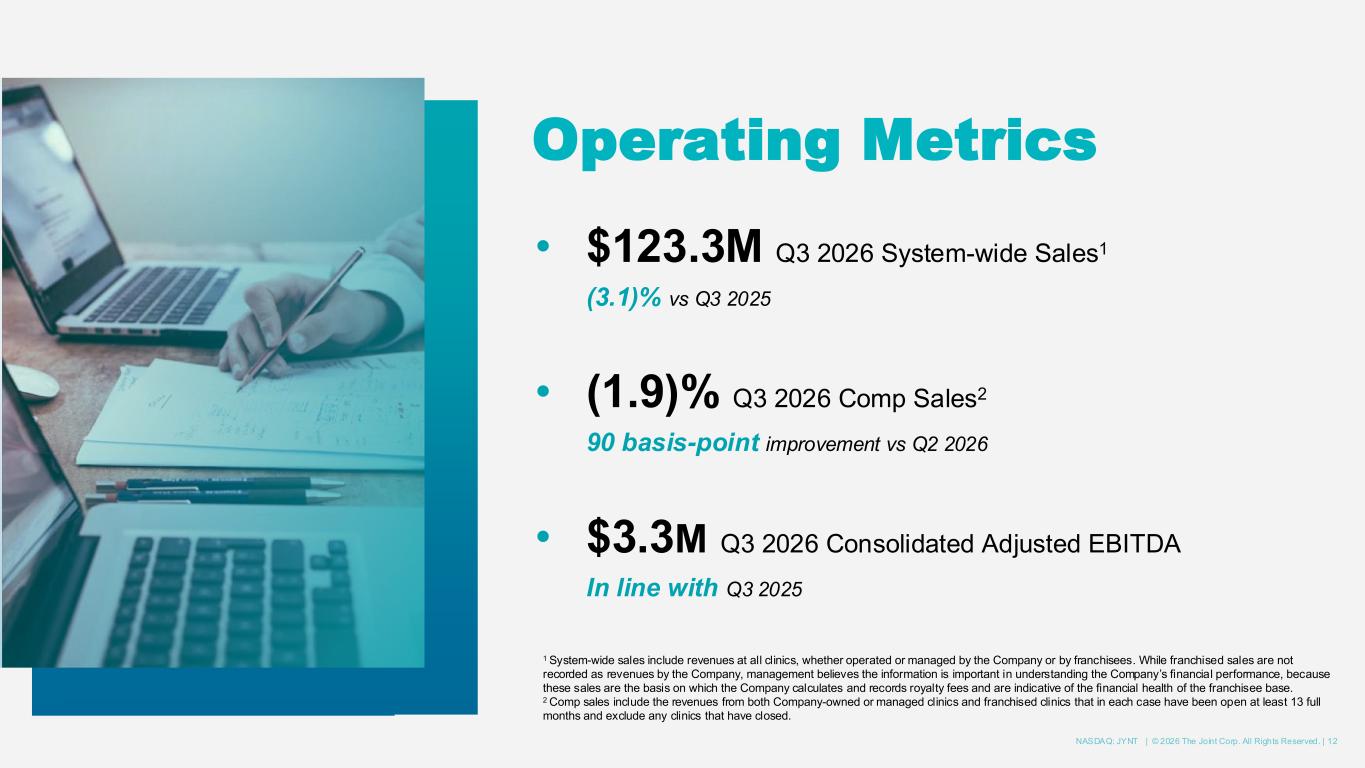
12NASDAQ: JYNT | © 2026 The Joint Corp. All Rights Reserved. | • $123.3M Q3 2026 System-wide Sales1 (3.1)% vs Q3 2025 • (1.9)% Q3 2026 Comp Sales2 90 basis-point improvement vs Q2 2026 • $3.3M Q3 2026 Consolidated Adjusted EBITDA In line with Q3 2025 1 System-wide sales include revenues at all clinics, whether operated or managed by the Company or by franchisees. While franchised sales are not recorded as revenues by the Company, management believes the information is important in understanding the Company’s financial performance, because these sales are the basis on which the Company calculates and records royalty fees and are indicative of the financial health of the franchisee base. 2 Comp sales include the revenues from both Company-owned or managed clinics and franchised clinics that in each case have been open at least 13 full months and exclude any clinics that have closed. Operating Metrics
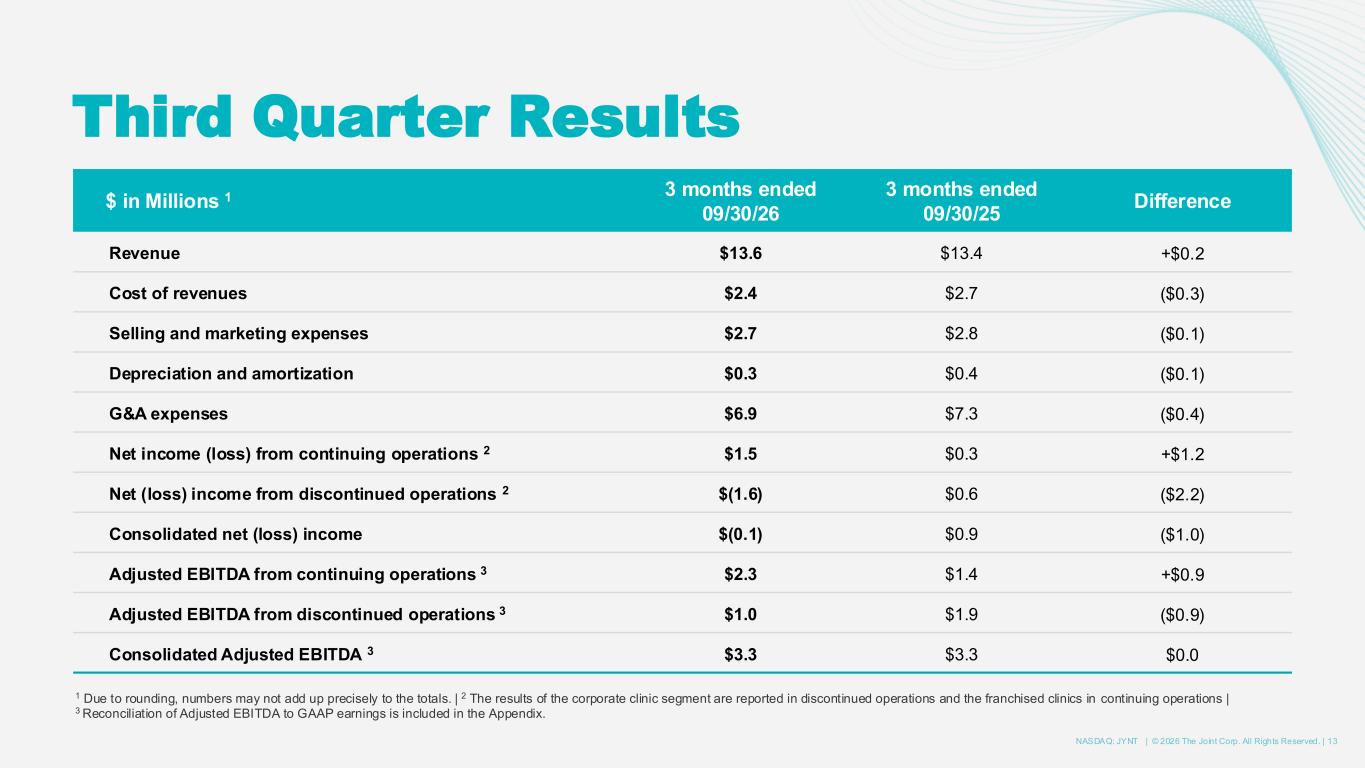
13NASDAQ: JYNT | © 2026 The Joint Corp. All Rights Reserved. | Third Quarter Results $ in Millions 1 3 months ended 09/30/26 3 months ended 09/30/25 Difference Revenue $13.6 $13.4 +$0.2 Cost of revenues $2.4 $2.7 ($0.3) Selling and marketing expenses $2.7 $2.8 ($0.1) Depreciation and amortization $0.3 $0.4 ($0.1) G&A expenses $6.9 $7.3 ($0.4) Net income (loss) from continuing operations 2 $1.5 $0.3 +$1.2 Net (loss) income from discontinued operations 2 $(1.6) $0.6 ($2.2) Consolidated net (loss) income $(0.1) $0.9 ($1.0) Adjusted EBITDA from continuing operations 3 $2.3 $1.4 +$0.9 Adjusted EBITDA from discontinued operations 3 $1.0 $1.9 ($0.9) Consolidated Adjusted EBITDA 3 $3.3 $3.3 $0.0 1 Due to rounding, numbers may not add up precisely to the totals. | 2 The results of the corporate clinic segment are reported in discontinued operations and the franchised clinics in continuing operations | 3 Reconciliation of Adjusted EBITDA to GAAP earnings is included in the Appendix.
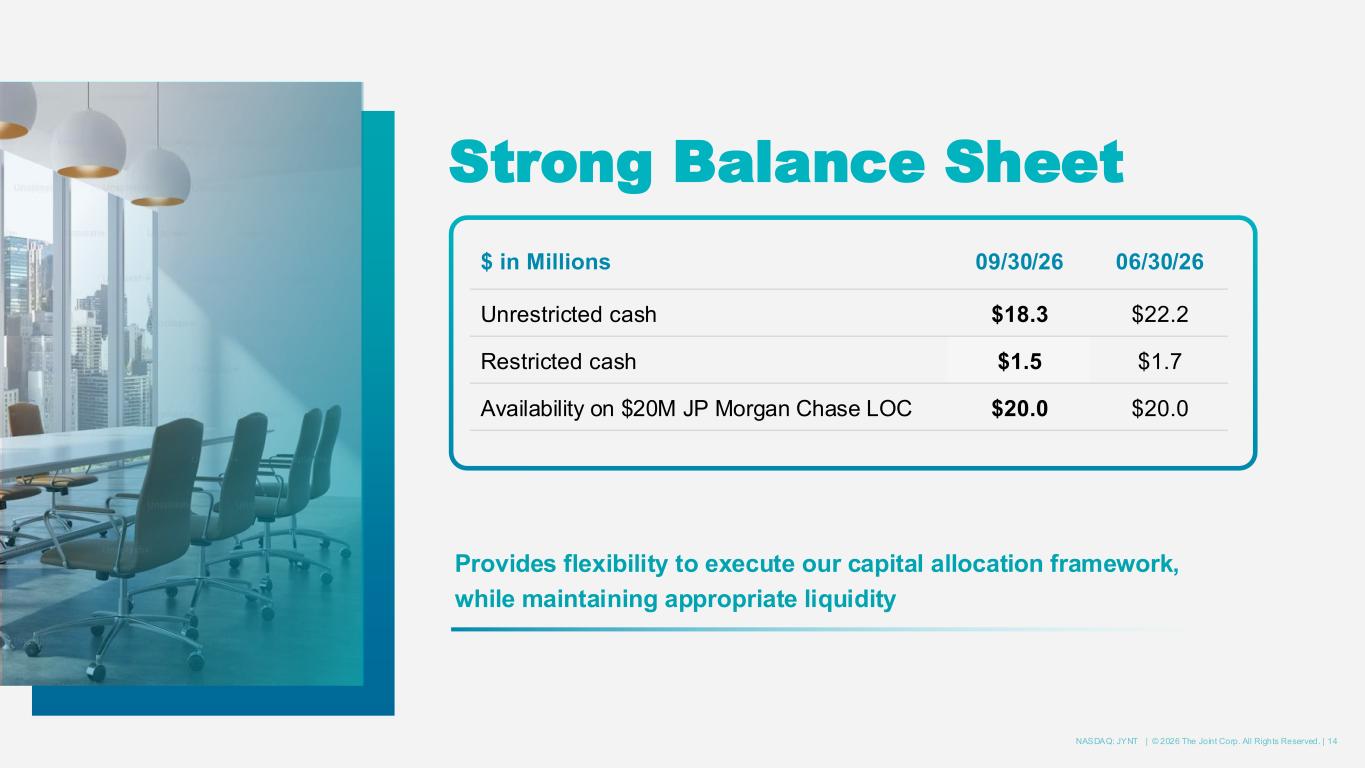
14NASDAQ: JYNT | © 2026 The Joint Corp. All Rights Reserved. | Strong Balance Sheet $ in Millions 09/30/26 06/30/26 Unrestricted cash $18.3 $22.2 Restricted cash $1.5 $1.7 Availability on $20M JP Morgan Chase LOC $20.0 $20.0 Provides flexibility to execute our capital allocation framework, while maintaining appropriate liquidity
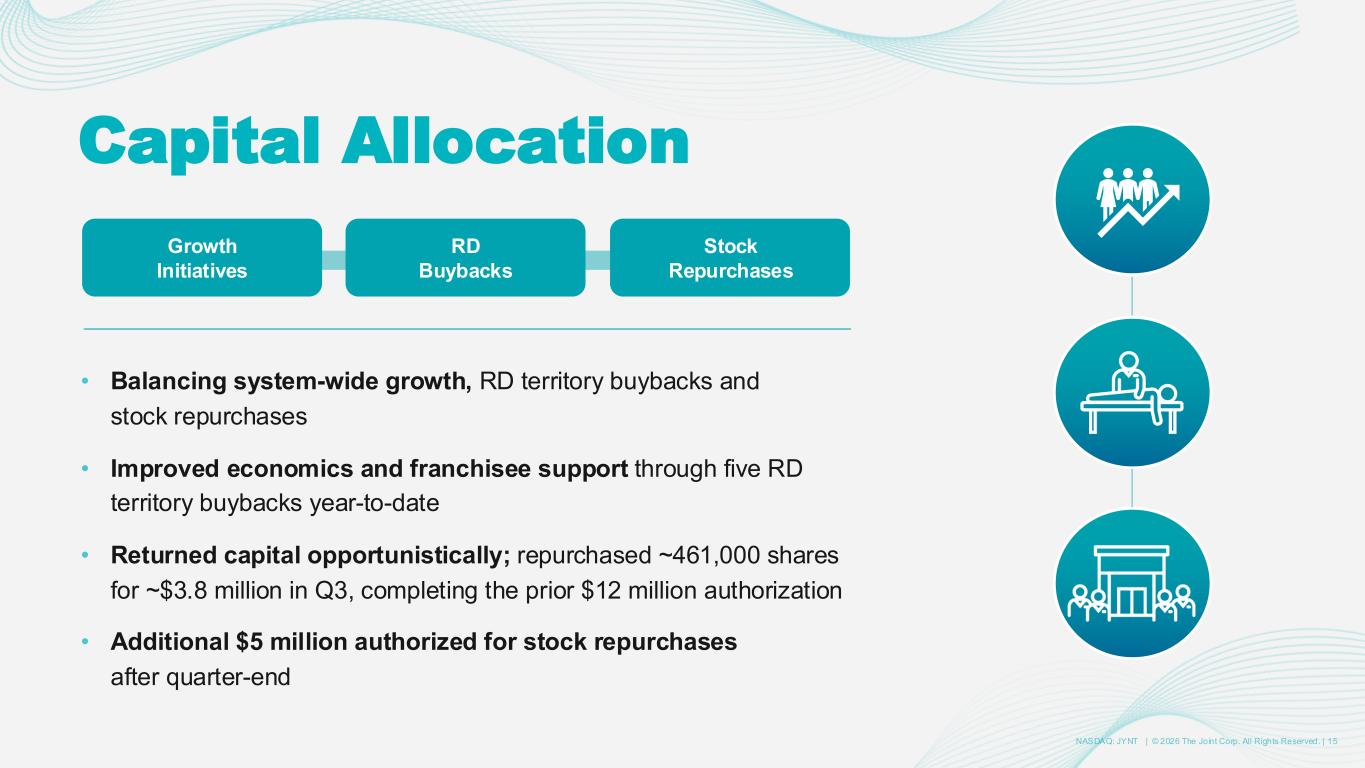
15NASDAQ: JYNT | © 2026 The Joint Corp. All Rights Reserved. | • Balancing system-wide growth, RD territory buybacks and stock repurchases • Improved economics and franchisee support through five RD territory buybacks year-to-date • Returned capital opportunistically; repurchased ~461,000 shares for ~$3.8 million in Q3, completing the prior $12 million authorization • Additional $5 million authorized for stock repurchases after quarter-end Growth Initiatives RD Buybacks Stock Repurchases Capital Allocation
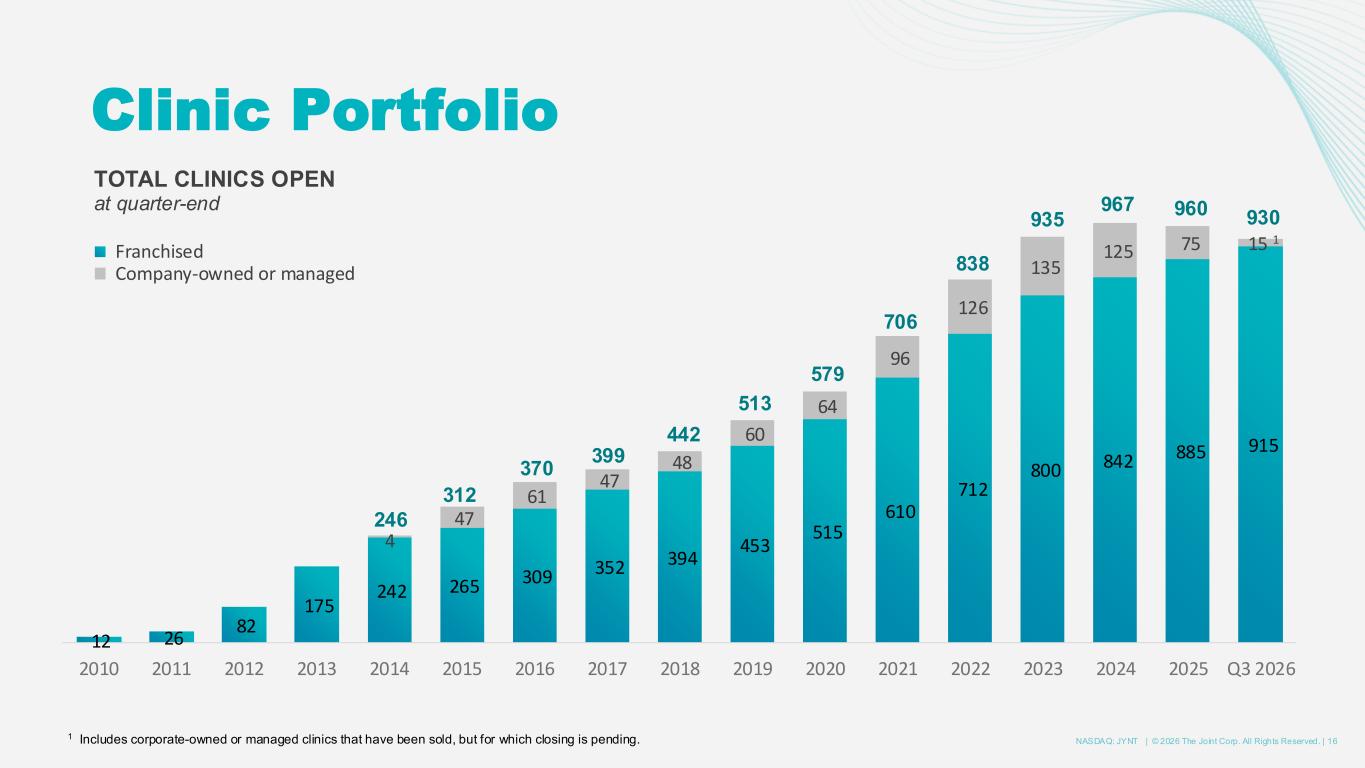
16NASDAQ: JYNT | © 2026 The Joint Corp. All Rights Reserved. | 12 26 82 175 242 265 309 352 394 453 515 610 712 800 842 885 915 4 47 61 47 48 60 64 96 126 135 125 75 15 1 2010 2011 2012 2013 2014 2015 2016 2017 2018 2019 2020 2021 2022 2023 2024 2025 Q3 2026 TOTAL CLINICS OPEN at quarter-end Franchised Company-owned or managed Clinic Portfolio 1 Includes corporate-owned or managed clinics that have been sold, but for which closing is pending. 370 399 442 513 312 246 579 706 838 935 967 960 930
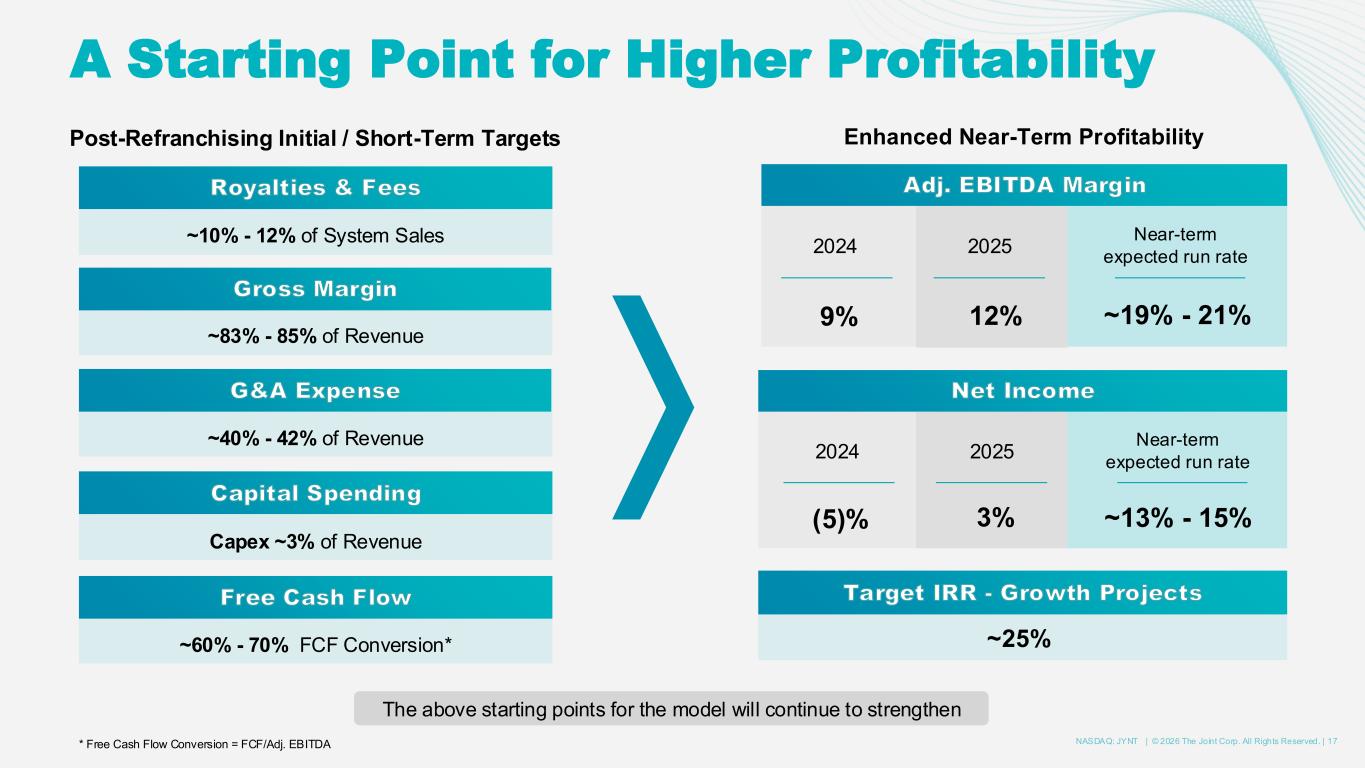
17NASDAQ: JYNT | © 2026 The Joint Corp. All Rights Reserved. | A Starting Point for Higher Profitability ~10% - 12% of System Sales ~83% - 85% of Revenue Asset Capex ~3% of Revenue Free Ca ~60% - 70% FCF Conversion* ~40% - 42% of Revenue Royalties & Fees Gross Margin G&A Expense Capital Spending Free Cash Flow * Free Cash Flow Conversion = FCF/Adj. EBITDA Post-Refranchising Initial / Short-Term Targets Target IRR - Growth Projects 9% ~13% - 15% 2025 3% Near-term expected run rate Net Income 2024 (5)% ~25% Enhanced Near-Term Profitability 12% ~19% - 21% Adj. EBITDA Margin 2025 Near-term expected run rate 2024 The above starting points for the model will continue to strengthen
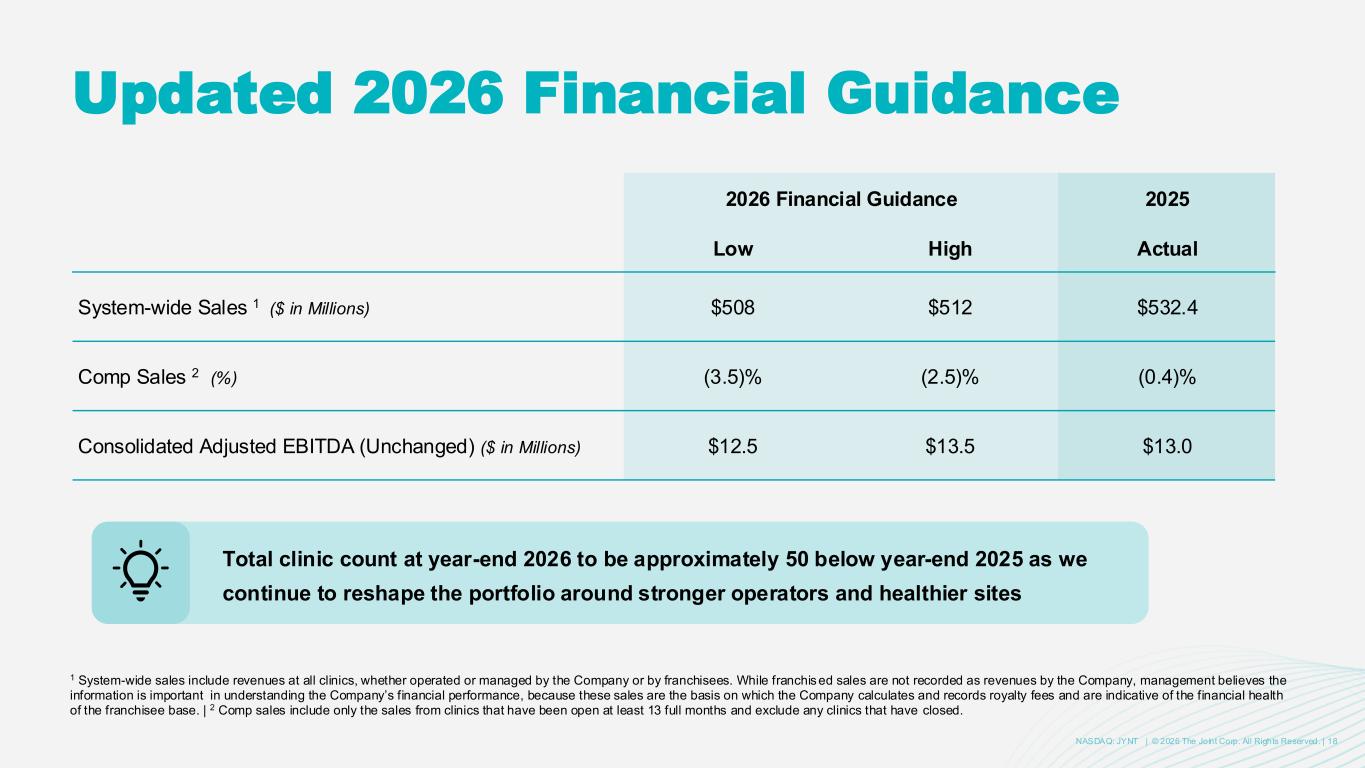
18NASDAQ: JYNT | © 2026 The Joint Corp. All Rights Reserved. | Updated 2026 Financial Guidance 2026 Financial Guidance 2025 Low High Actual System-wide Sales 1 ($ in Millions) $508 $512 $532.4 Comp Sales 2 (%) (3.5)% (2.5)% (0.4)% Consolidated Adjusted EBITDA (Unchanged) ($ in Millions) $12.5 $13.5 $13.0 1 System-wide sales include revenues at all clinics, whether operated or managed by the Company or by franchisees. While franchised sales are not recorded as revenues by the Company, management believes the information is important in understanding the Company’s financial performance, because these sales are the basis on which the Company calculates and records royalty fees and are indicative of the financial health of the franchisee base. | 2 Comp sales include only the sales from clinics that have been open at least 13 full months and exclude any clinics that have closed. Total clinic count at year-end 2026 to be approximately 50 below year-end 2025 as we continue to reshape the portfolio around stronger operators and healthier sites

19NASDAQ: JYNT | © 2026 The Joint Corp. All Rights Reserved. | Sanjiv Razdan CEO, President and Director
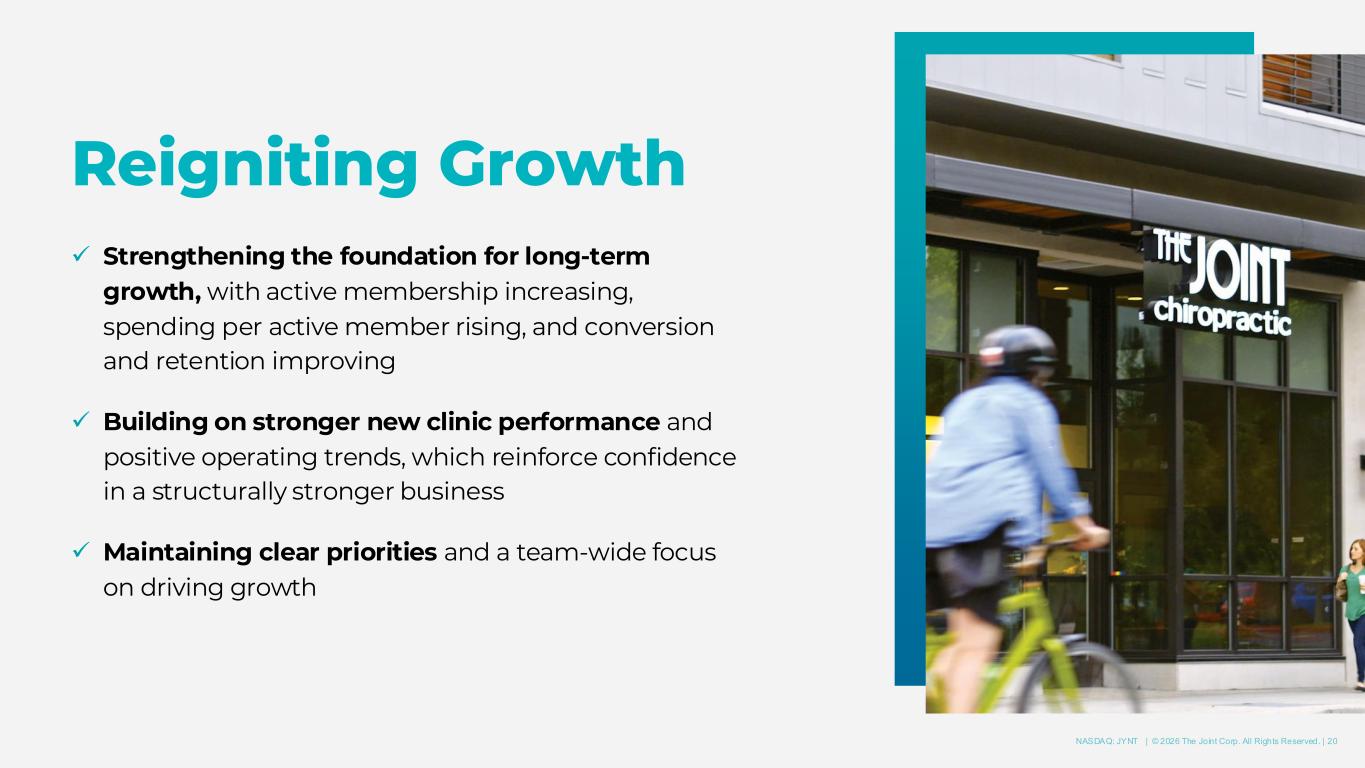
20NASDAQ: JYNT | © 2026 The Joint Corp. All Rights Reserved. | Reigniting Growth ✓ Strengthening the foundation for long-term growth, with active membership increasing, spending per active member rising, and conversion and retention improving ✓ Building on stronger new clinic performance and positive operating trends, which reinforce confidence in a structurally stronger business ✓ Maintaining clear priorities and a team-wide focus on driving growth
21NASDAQ: JYNT | © 2026 The Joint Corp. All Rights Reserved. | Performance Metrics and Non-GAAP Measures This presentation includes commonly discussed performance metrics. System-wide sales include revenues at all clinics, whether operated by the Company or by franchisees. While franchised sales are not recorded as revenues by the Company, management believes the information is important in understanding the Company’s financial performance because these sales are the basis on which the Company calculates and records royalty fees and are indicative of the financial health of the franchisee base. Comp sales include the revenues from both Company-owned or managed clinics and franchised clinics that in each case have been open at least 13 full months and exclude any clinics that have closed. This presentation includes non-GAAP financial measures. EBITDA and Adjusted EBITDA are presented because they are important measures used by management to assess financial performance, as management believes they provide a more transparent view of the Company’s underlying operating performance and operating trends. Free cash flow is presented as a supplemental measure of liquidity. Reconciliation of historical net income/(loss) to EBITDA and Adjusted EBITDA and reconciliation of operating activities cash flows to free cash flow is presented in the tables below. The Company defines EBITDA as net income/(loss) before net interest, tax expense, depreciation, and amortization expenses. The Company defines Adjusted EBITDA as EBITDA before acquisition-related expenses (which includes contract termination costs associated with reacquired RD rights), net (gain)/loss on disposition or impairment, stock-based compensation expenses, costs related to restatement filings, restructuring costs, and litigation expenses (consisting of legal and related fees for specific proceedings that arise outside of the ordinary course of our business). The Company defines free cash flow as net cash provided by (used in) operating activities less capital expenditures. EBITDA, Adjusted EBITDA and free cash flow do not represent and should not be considered alternatives to net income or cash flows from operations, as determined by accounting principles generally accepted in the United States (“GAAP”). While EBITDA and Adjusted EBITDA are used as measures of financial performance and free cash flow is used as a measure of liquidity, they are not necessarily comparable to other similarly titled captions of other companies due to potential inconsistencies in the methods of calculation. EBITDA, Adjusted EBITDA and free cash flow should be reviewed in conjunction with the Company’s financial statements filed with the Securities and Exchange Commission (the “SEC”). Please refer to the reconciliations of non-GAAP financial measures to their GAAP equivalents located at the end of this presentation. This presentation includes forward- looking guidance for certain non-GAAP financial measures, including Adjusted EBITDA. These measures will differ from net income (loss), determined in accordance with GAAP, in ways similar to those described in the reconciliations at the end of this presentation. We are not able to provide, without unreasonable effort, guidance for net income (loss), determined in accordance with GAAP, or a reconciliation of guidance for Adjusted EBITDA to the most directly comparable GAAP measure because the Company is not able to predict with reasonable certainty the amount or nature of all items that will be included in net income (loss)
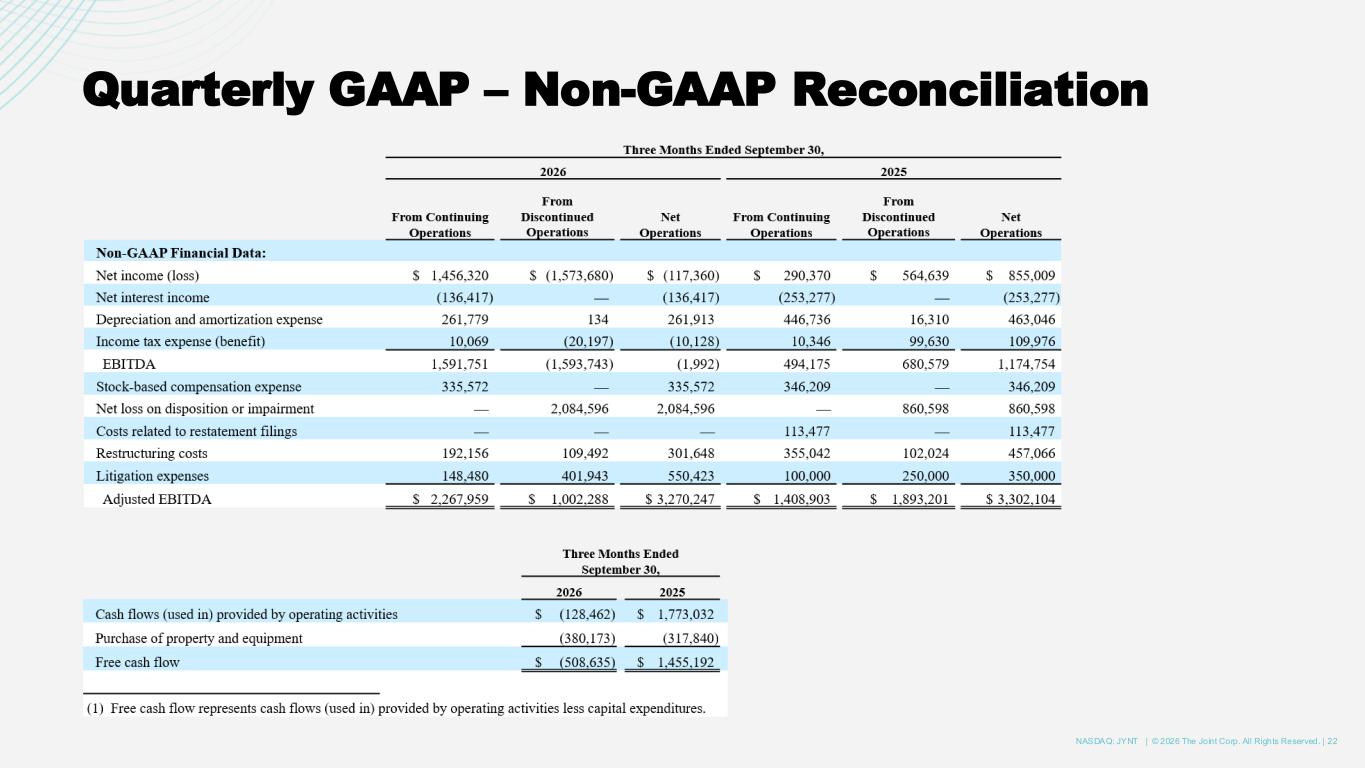
22NASDAQ: JYNT | © 2026 The Joint Corp. All Rights Reserved. | Quarterly GAAP – Non-GAAP Reconciliation

23NASDAQ: JYNT | © 2026 The Joint Corp. All Rights Reserved. | Scott Bowman, CFO scott.bowman@thejoint.com The Joint Corp. 16767 N. Perimeter Dr., Suite 110, Scottsdale, AZ 85260 | (480) 245-5960 Sanjiv Razdan, President & CEO sanjiv.razdan@thejoint.com The Joint Corp. 16767 N. Perimeter Dr., Suite 110, Scottsdale, AZ 85260 | (480) 245-5960 Richard Land, Investor Relations thejointinvestor@allianceadvisors.com Alliance Advisors Investor Relations 800 Third Ave, 17th Floor | New York, NY 10022| (212) 838-3777 https://www.facebook.com/thejointchiro @thejointchiro https://twitter.com/thejointchiro @thejointchiro https://www.youtube.com/thejointcorp @thejointcorp