
EXHIBIT 99.2
Q4 2023 Financial Results As of December 31, 2023 | Reported on March 7, 2024 Exhibit 99.2

Safe Harbor Statements Certain statements contained in this presentation are "forward - looking statements” about future events and expectations. Forward - looking statements are based on our beliefs, assumptions and expectations of industry trends, our future financial and operating performance and our growth plans, taking into account the information currently available to us. These statements are not statements of historical fact. Words such as, "anticipates," "believes," "continues," "estimates," "expects," "goal," "objectives," "intends," "may," "opportunity," "plans," "potential," "near - term," "long - term," "projections," "assumptions," "projects," "guidance," "forecasts," "outlook," "target," "trends," "should," "could," "would," "will," and similar expressions are intended to identify such forward - looking statements. . Specific forward looking statements made in this presentation include, among others our refranchising strategy; our implementation of new marketing programs; 2024 guidance for system - wide sales, system - wide comp sales for all clinics open 13 months or more, and new franchised clinic openings excluding the impact of refranchised clinics; our belief that people will continue to seek more noninvasive, holistic ways to manage their pain and that we’ll be there to treat them; our leading chiropractic care franchise concept; our mission to improve quality of life through routine and affordable chiropractic care; our upside for future growth; our substantial opportunity for market share growth; and our growing market opportunity. Forward - looking statements involve risks and uncertainties that may cause our actual results to differ materially from the expectations of future results we express or imply in any forward - looking statements, and you should not place undue reliance on such statements. Factors that could contribute to these differences include, but are not limited to, our inability to identify and recruit enough qualified chiropractors and other personnel to staff our clinics, due in part to the nationwide labor shortage and an increase in operating expenses due to measures we may need to take to address such shortage; inflation, and the current war in Ukraine, which has increased our costs and which could otherwise negatively impact our business; the potential for disruption to our operations and the unpredictable impact on our business of outbreaks of contagious diseases; our failure to profitably operate company - owned or managed clinics; short - selling strategies and negative opinions posted on the internet, which could drive down the market price of our common stock and result in class action lawsuits; our failure to remediate future material weaknesses in our internal control over financial reporting, which could negatively impact our ability to accurately report our financial results, prevent fraud, or maintain investor confidence; and other factors described in our filings with the SEC, including in the section entitled “Risk Factors” in our Annual Report on Form 10 - K/A for the year ended December 31, 2022 filed with the SEC on September 26, 2023 and subsequently - filed current and quarterly reports. We qualify any forward - looking statements entirely by these cautionary factors. We assume no obligation to update or revise any forward - looking statements for any reason or to update the reasons actual results could differ materially from those anticipated in these forward - looking statements, even if new information becomes available in the future. Comparisons of results for current and any prior periods are not intended to express any future trends or indications of future performance, unless expressed as such, and should only be viewed as historical data. Business Structure The Joint Corp. is a franchisor of clinics and an operator of clinics in certain states. In Arkansas, California, Colorado, District of Columbia, Florida, Illinois, Kansas, Kentucky, Maryland, Michigan, Minnesota, New Jersey, New York, North Carolina, Oregon, Pennsylvania, Rhode Island, South Dakota, Tennessee, Washington, West Virginia and Wyoming. The Joint Corp. and its franchisees provide management services to affiliated professional chiropractic practices. 2 © 2024 The Joint Corp. All Rights Reserved.
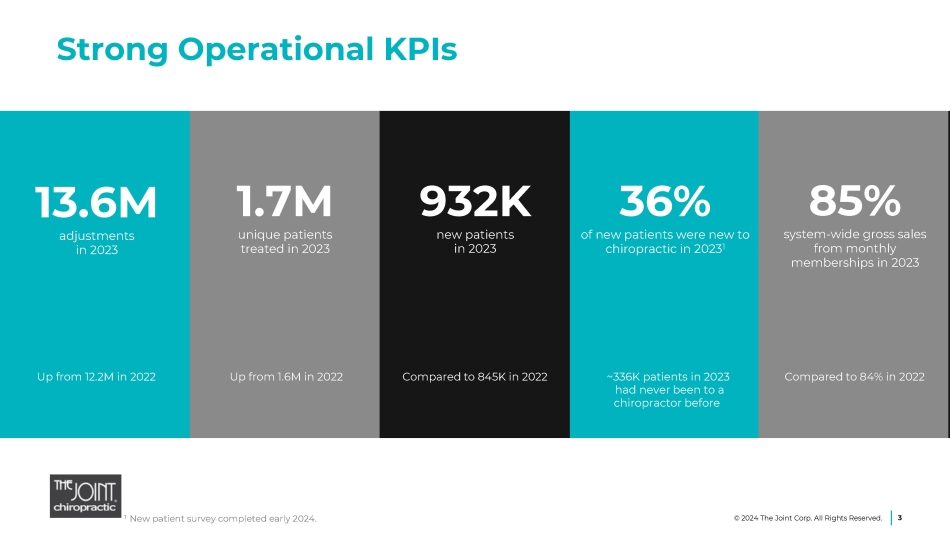
Strong Operational KPIs 1 New patient survey completed early 2024. 1.7M unique patients treated in 2023 932K new patients in 2023 13.6M adjustments in 2023 36% of new patients were new to chiropractic in 2023 1 85% system - wide gross sales from monthly memberships in 2023 Up from 1.6M in 2022 ~336K patients in 2023 had never been to a chiropractor before Compared to 845K in 2022 Up from 12.2M in 2022 Compared to 84% in 2022 3 © 2024 The Joint Corp. All Rights Reserved.
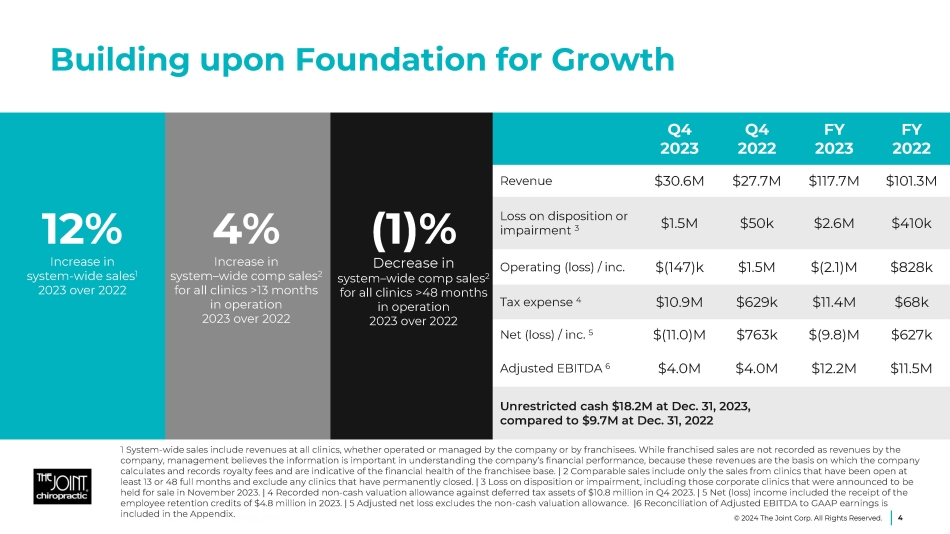
Building upon Foundation for Growth 1 System - wide sales include revenues at all clinics, whether operated or managed by the company or by franchisees. While franchised sales are not recorded as revenues by the company, management believes the information is important in understanding the company’s financial performance, because these revenues are the basis on which the company calculates and records royalty fees and are indicative of the financial health of the franchisee base. | 2 Comparable sales include only the sales from clinics that have been open at least 13 or 48 full months and exclude any clinics that have permanently closed. | 3 Loss on disposition or impairment, including those corporate clinics that were announced to be held for sale in November 2023. | 4 Recorded non - cash valuation allowance against deferred tax assets of $10.8 million in Q4 2023. | 5 Net (loss) income included the receipt of the employee retention credits of $4.8 million in 2023. | 5 Adjusted net loss excludes the non - cash valuation allowance. |6 Reconciliation of Adjusted EBITDA to GAAP earnings is included in the Appendix. 12% Increase in system - wide sales 1 2023 over 2022 4% Increase in system – wide comp sales 2 for all clinics >13 months in operation 2023 over 2022 FY 2022 FY 2023 Q4 2022 Q4 2023 $101.3M $117.7M $27.7M $30.6M Revenue $410k $2.6M $50k $1.5M (1)% Loss on disposition or impairment 3 $828k $(2.1)M $1.5M $(147)k Decrease in Operating (loss) / inc. system – wide comp sales 2 $68k $11.4M $629k $10.9M for all clinics >48 months in operation Tax expense 4 $627k $(9.8)M $763k $(11.0)M 2023 over 2022 Net (loss) / inc. 5 $11.5M $12.2M $4.0M $4.0M Adjusted EBITDA 6 Unrestricted cash $18.2M at Dec. 31, 2023, compared to $9.7M at Dec. 31, 2022 © 2024 The Joint Corp. All Rights Reserved. 4
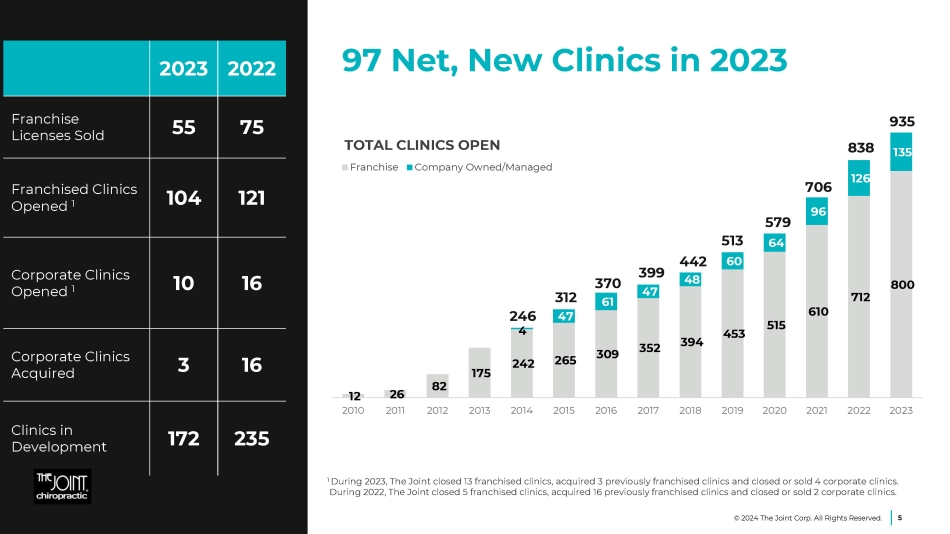
97 Net, New Clinics in 2023 2022 2023 75 55 Franchise Licenses Sold 121 104 Franchised Clinics Opened 1 16 10 Corporate Clinics Opened 1 16 3 Corporate Clinics Acquired 235 172 Clinics in Development 12 26 82 175 242 265 309 352 394 453 515 610 712 800 4 47 61 47 48 60 64 96 126 135 2010 2011 2012 2013 2014 2015 2016 2017 2018 2019 2020 2021 2022 2023 TOTAL CLINICS OPEN Franchise Company Owned/Managed 370 399 442 513 312 246 579 706 838 935 1 During 2023, The Joint closed 13 franchised clinics, acquired 3 previously franchised clinics and closed or sold 4 corporate clinics. During 2022, The Joint closed 5 franchised clinics, acquired 16 previously franchised clinics and closed or sold 2 corporate clinics. 5 © 2024 The Joint Corp. All Rights Reserved.
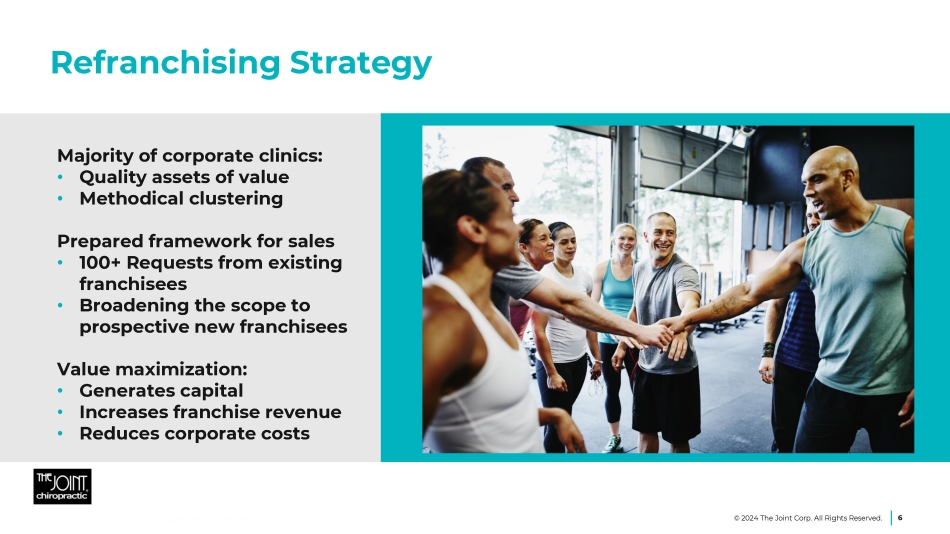
Refranchising Strategy Majority of corporate clinics: • Quality assets of value • Methodical clustering Prepared framework for sales • 100+ Requests from existing franchisees • Broadening the scope to prospective new franchisees Value maximization: • Generates capital • Increases franchise revenue • Reduces corporate costs 6 © 2024 The Joint Corp. All Rights Reserved.
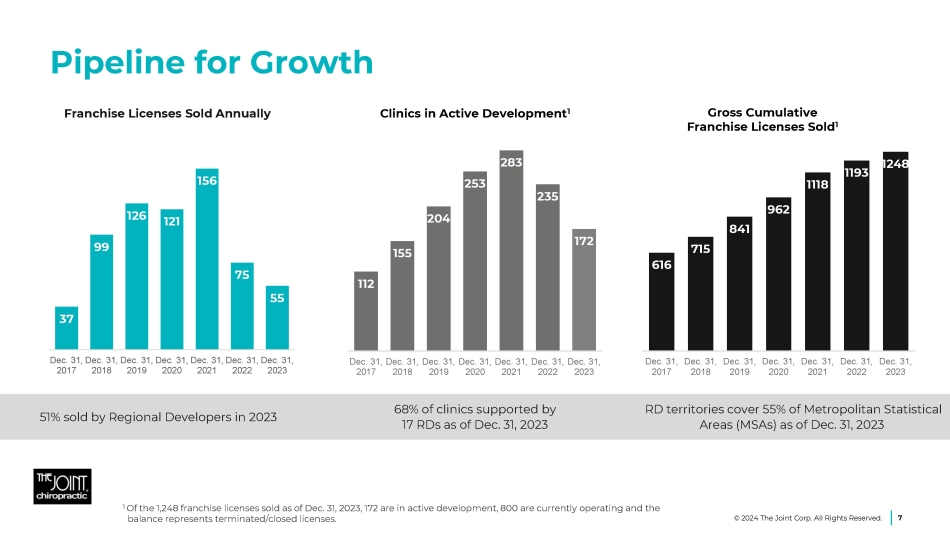
RD territories cover 55% of Metropolitan Statistical Areas (MSAs) as of Dec. 31, 2023 68% of clinics supported by 17 RDs as of Dec. 31, 2023 51% sold by Regional Developers in 2023 37 99 126 121 156 75 55 Dec. 31, Dec. 31, Dec. 31, Dec. 31, Dec. 31, Dec. 31, Dec. 31, 2017 2018 2019 2020 2021 2022 2023 616 715 841 962 1118 1193 1248 Dec. 31, Dec. 31, Dec. 31, Dec. 31, Dec. 31, Dec. 31, Dec. 31, 2017 2018 2019 2020 2021 2022 2023 112 155 204 253 283 235 172 Dec. 31, Dec. 31, Dec. 31, Dec. 31, Dec. 31, Dec. 31, Dec. 31, 2017 2018 2019 2020 2021 2022 2023 Pipeline for Growth 1 Of the 1,248 franchise licenses sold as of Dec. 31, 2023, 172 are in active development, 800 are currently operating and the balance represents terminated/closed licenses. Gross Cumulative Franchise Licenses Sold 1 Franchise Licenses Sold Annually Clinics in Active Development 1 7 © 2024 The Joint Corp. All Rights Reserved.
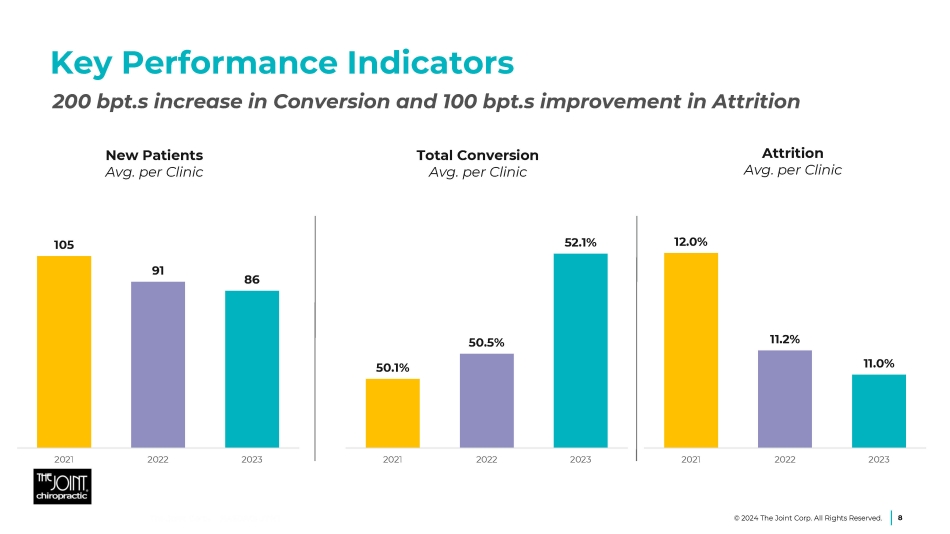
Key Performance Indicators 12.0% 11.2% 11.0% 2021 2022 2023 Attrition Avg. per Clinic 8 © 2024 The Joint Corp. All Rights Reserved. Total Conversion Avg. per Clinic 50.1% 50.5% 52.1% 2021 2022 2023 New Patients Avg. per Clinic 105 91 86 2021 2022 2023 200 bpt.s increase in Conversion and 100 bpt.s improvement in Attrition
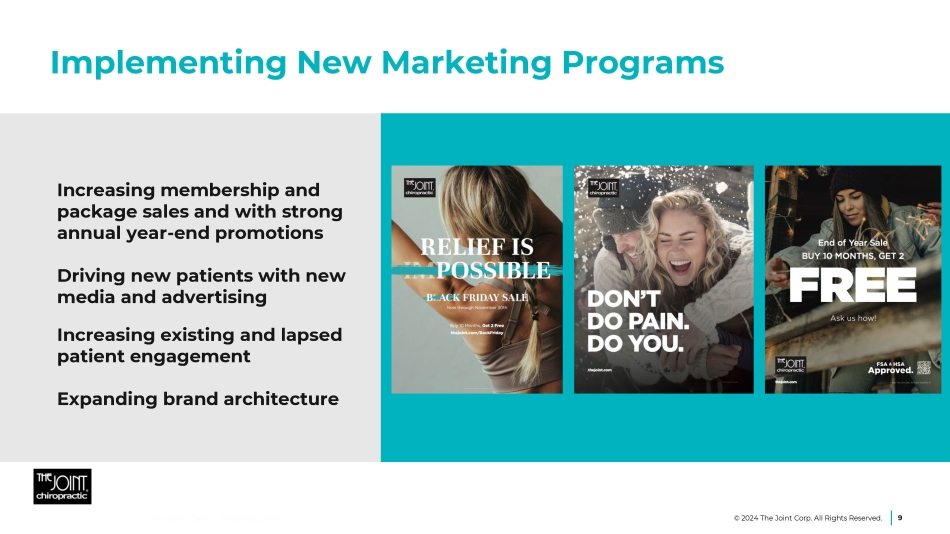
Implementing New Marketing Programs Increasing membership and package sales and with strong annual year - end promotions Driving new patients with new media and advertising Increasing existing and lapsed patient engagement Expanding brand architecture 9 © 2024 The Joint Corp. All Rights Reserved.
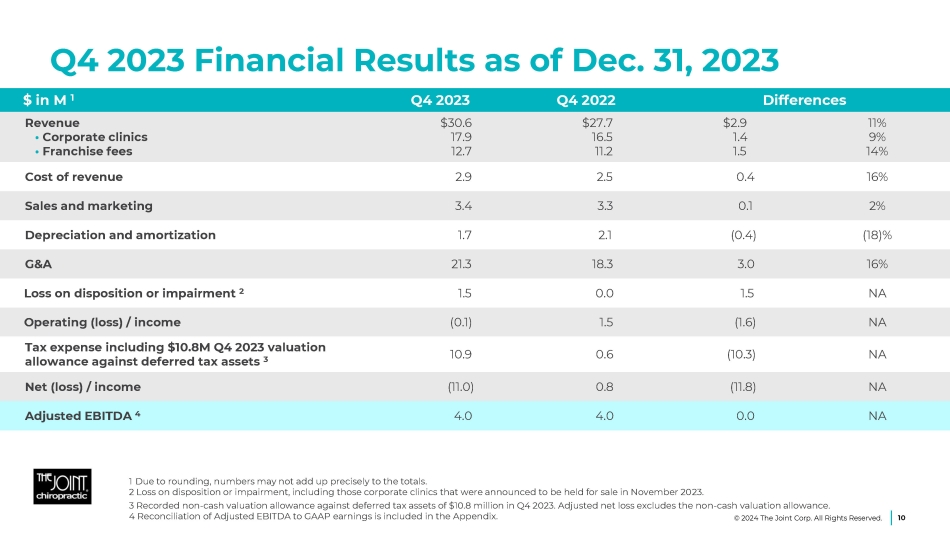
Q4 2023 Financial Results as of Dec. 31, 2023 Differences Q4 2022 Q4 2023 $ in M 1 11% 9% 14% $2.9 1.4 1.5 $27.7 16.5 11.2 $30.6 17.9 12.7 Revenue • Corporate clinics • Franchise fees 16% 0.4 2.5 2.9 Cost of revenue 2% 0.1 3.3 3.4 Sales and marketing (18)% (0.4) 2.1 1.7 Depreciation and amortization 16% 3.0 18.3 21.3 G&A NA 1.5 0.0 1.5 Loss on disposition or impairment 2 NA (1.6) 1.5 (0.1) Operating (loss) / income NA (10.3) 0.6 10.9 Tax expense including $10.8M Q4 2023 valuation allowance against deferred tax assets 3 NA (11.8) 0.8 (11.0) Net (loss) / income NA 0.0 4.0 4.0 Adjusted EBITDA 4 1 Due to rounding, numbers may not add up precisely to the totals. 2 Loss on disposition or impairment, including those corporate clinics that were announced to be held for sale in November 2023. 3 Recorded non - cash valuation allowance against deferred tax assets of $10.8 million in Q4 2023. Adjusted net loss excludes the non - cash valuation allowance. 4 Reconciliation of Adjusted EBITDA to GAAP earnings is included in the Appendix. 10 © 2024 The Joint Corp. All Rights Reserved.
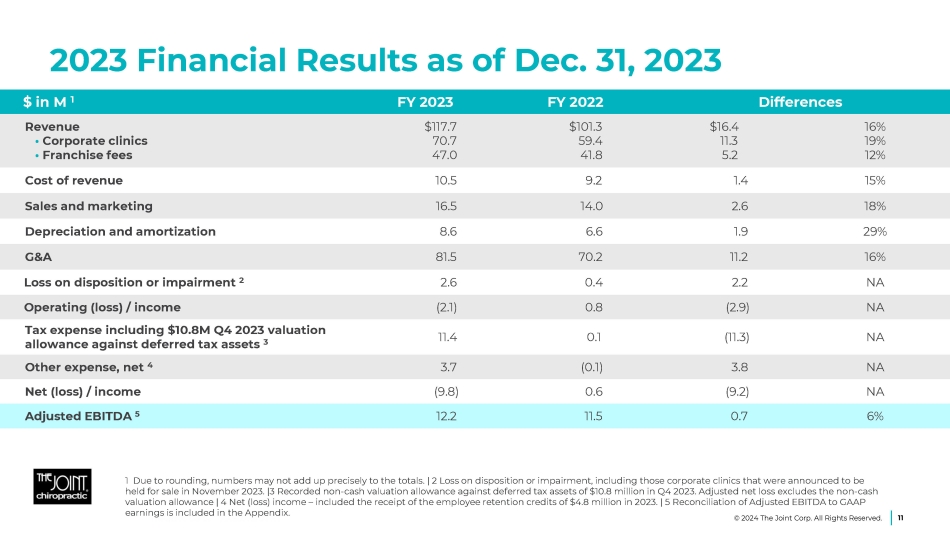
2023 Financial Results as of Dec. 31, 2023 Differences FY 2022 FY 2023 $ in M 1 16% 19% 12% $16.4 11.3 5.2 $101.3 59.4 41.8 $117.7 70.7 47.0 Revenue • Corporate clinics • Franchise fees 15% 1.4 9.2 10.5 Cost of revenue 18% 2.6 14.0 16.5 Sales and marketing 29% 1.9 6.6 8.6 Depreciation and amortization 16% 11.2 70.2 81.5 G&A NA 2.2 0.4 2.6 Loss on disposition or impairment 2 NA (2.9) 0.8 (2.1) Operating (loss) / income NA (11.3) 0.1 11.4 Tax expense including $10.8M Q4 2023 valuation allowance against deferred tax assets 3 NA 3.8 (0.1) 3.7 Other expense, net 4 NA (9.2) 0.6 (9.8) Net (loss) / income 6% 0.7 11.5 12.2 Adjusted EBITDA 5 1 Due to rounding, numbers may not add up precisely to the totals. | 2 Loss on disposition or impairment, including those corporate clinics that were announced to be held for sale in November 2023. |3 Recorded non - cash valuation allowance against deferred tax assets of $10.8 million in Q4 2023. Adjusted net loss excludes the non - cash valuation allowance | 4 Net (loss) income – included the receipt of the employee retention credits of $4.8 million in 2023. | 5 Reconciliation of Adjusted EBITDA to GAAP earnings is included in the Appendix. 11 © 2024 The Joint Corp. All Rights Reserved.
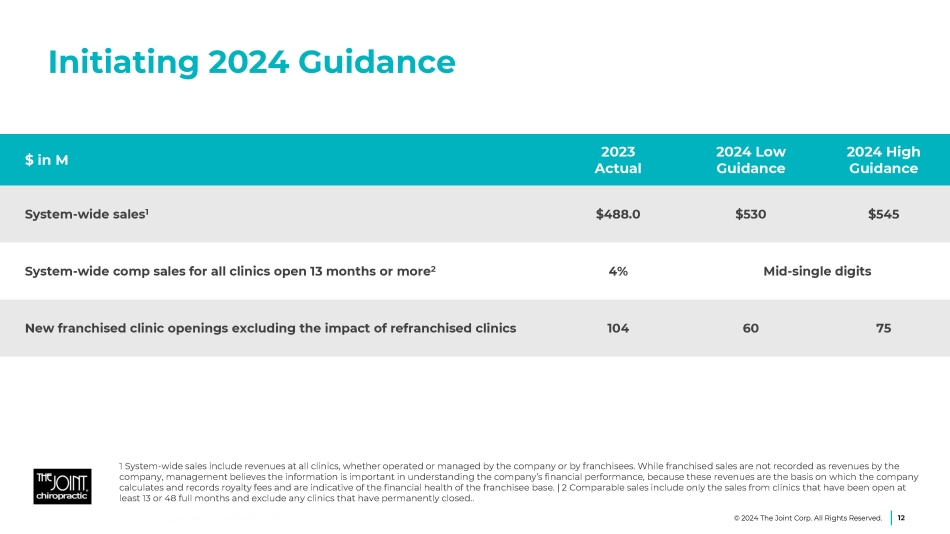
Initiating 2024 Guidance 2024 High Guidance 2024 Low Guidance 2023 Actual $ in M $545 $530 $488.0 System - wide sales 1 Mid - single digits 4% System - wide comp sales for all clinics open 13 months or more 2 75 60 104 New franchised clinic openings excluding the impact of refranchised clinics 1 System - wide sales include revenues at all clinics, whether operated or managed by the company or by franchisees. While franchised sales are not recorded as revenues by the company, management believes the information is important in understanding the company’s financial performance, because these revenues are the basis on which the company calculates and records royalty fees and are indicative of the financial health of the franchisee base. | 2 Comparable sales include only the sales from clinics that have been open at least 13 or 48 full months and exclude any clinics that have permanently closed.. © 2024 The Joint Corp. All Rights Reserved. 12
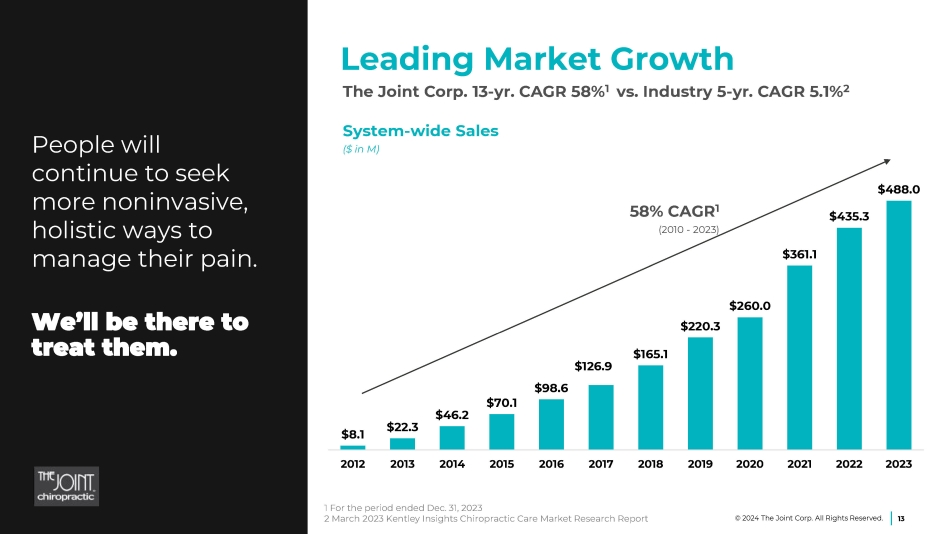
$8.1 $22.3 $70.1 $46.2 $126.9 $98.6 $165.1 $220.3 $260.0 $361.1 $435.3 $488.0 2012 2013 2014 2015 2016 2017 2018 2019 2020 2021 2022 2023 Leading Market Growth The Joint Corp. 13 - yr. CAGR 58% 1 vs. Industry 5 - yr. CAGR 5.1% 2 People will continue to seek more noninvasive, holistic ways to manage their pain. We’ll be there to treat them. 1 For the period ended Dec. 31, 2023 2 March 2023 Kentley Insights Chiropractic Care Market Research Report 13 © 2024 The Joint Corp. All Rights Reserved. System - wide Sales ($ in M) 58% CAGR 1 (2010 - 2023)
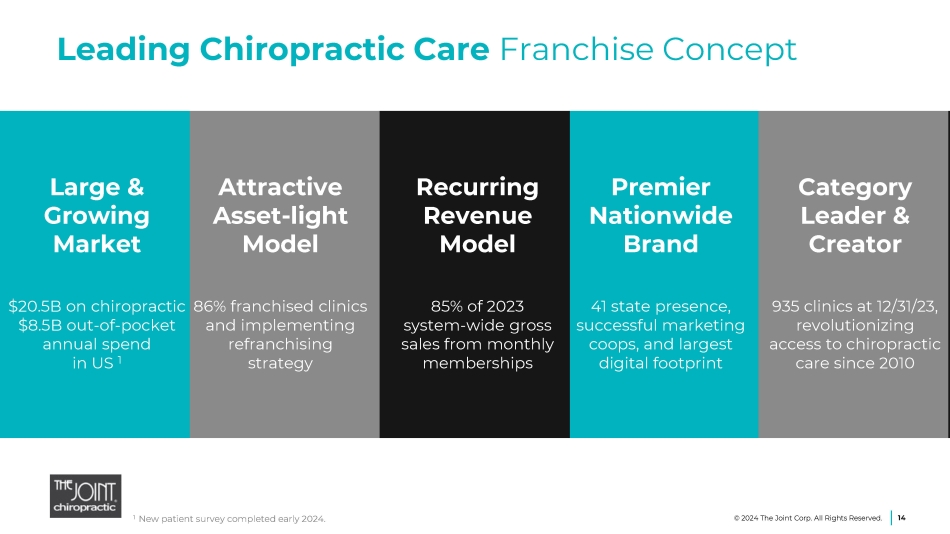
Leading Chiropractic Care Franchise Concept 1 New patient survey completed early 2024. Attractive Asset - light Model and implementing refranchising strategy 14 © 2024 The Joint Corp. All Rights Reserved. Category Leader & Creator 935 clinics at 12/31/23, revolutionizing access to chiropractic care since 2010 Large & Growing Market $20.5B on chiropractic 86% franchised clinics $8.5B out - of - pocket annual spend in US 1 Recurring Revenue Model 85% of 2023 system - wide gross sales from monthly memberships Premier Nationwide Brand 41 state presence, successful marketing coops, and largest digital footprint

15 Appendix © 2024 The Joint Corp. All Rights Reserved.
Performance Metrics and Non - GAAP Measures 16 This presentation includes commonly discussed performance metrics. System - wide sales include sales at all clinics, whether operated by the company or by franchisees. While franchised sales are not recorded as revenues by the company, management believes the information is important in understanding the company’s financial performance, because these sales are the basis on which the company calculates and records royalty fees and are indicative of the financial health of the franchisee base. Comp sales include the sales from both company - owned or managed clinics and franchised clinics that in each case have been open at least 13 full months and exclude any clinics that have closed. This presentation includes non - GAAP financial measures. EBITDA and Adjusted EBITDA are presented because they are important measures used by management to assess financial performance, as management believes they provide a more transparent view of the Company’s underlying operating performance and operating trends than GAAP measures alone. Reconciliations of net loss to EBITDA and Adjusted EBITDA are presented where applicable. The Company defines EBITDA as net income/(loss) before net interest, tax expense, depreciation, and amortization expenses. The company defines Adjusted EBITDA as EBITDA before acquisition - related expenses(which includes contract termination costs associated with reacquired regional developer rights), net (gain)/loss on disposition or impairment, stock - based compensation expenses, costs related to restatement filings, restructuring costs and other income related to employee retention credits. EBITDA and Adjusted EBITDA do not represent and should not be considered alternatives to net income or cash flows from operations, as determined by accounting principles generally accepted in the United States, or GAAP. While EBITDA and Adjusted EBITDA are frequently used as measures of financial performance and the ability to meet debt service requirements, they are not necessarily comparable to other similarly titled captions of other companies due to potential inconsistencies in the methods of calculation. EBITDA and Adjusted EBITDA should be reviewed in conjunction with the Company’s financial statements filed with the SEC. Information reconciling forward - looking Adjusted EBITDA to net income/(loss) is unavailable to the company without unreasonable effort. The company is not able to provide a quantitative reconciliation of adjusted EBITDA to net income/(loss) because certain items required for such reconciliation are uncertain, outside of the company's control, and/or cannot be reasonably predicted, including but not limited to [the provision for (benefit from) income taxes. Preparation of such reconciliation would require a forward - looking statement of income and statement of cash flows prepared in accordance with GAAP, and such forward - looking financial statements are unavailable to the company without unreasonable effort. © 2024 The Joint Corp. All Rights Reserved.
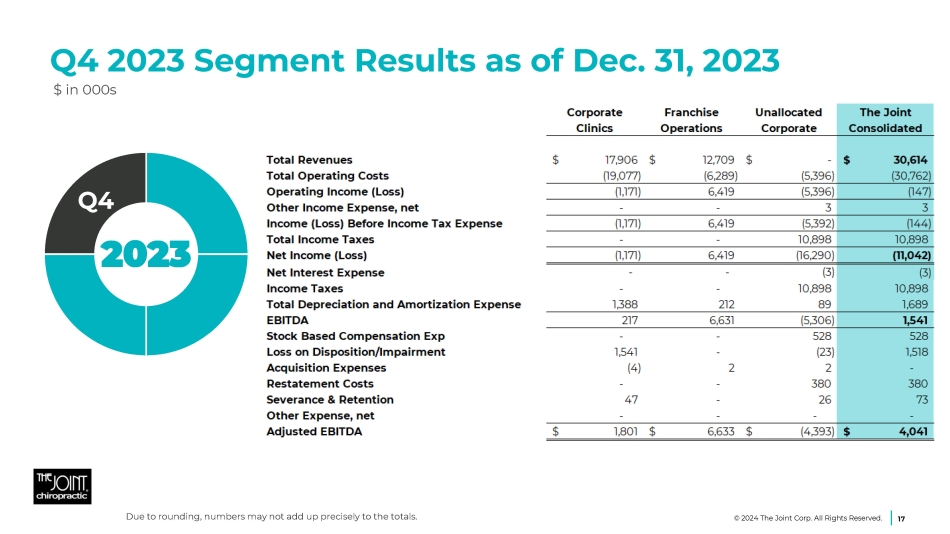
Q4 2023 Segment Results as of Dec. 31, 2023 $ in 000s 17 Q4 2023 © 2024 The Joint Corp. All Rights Reserved. Due to rounding, numbers may not add up precisely to the totals.
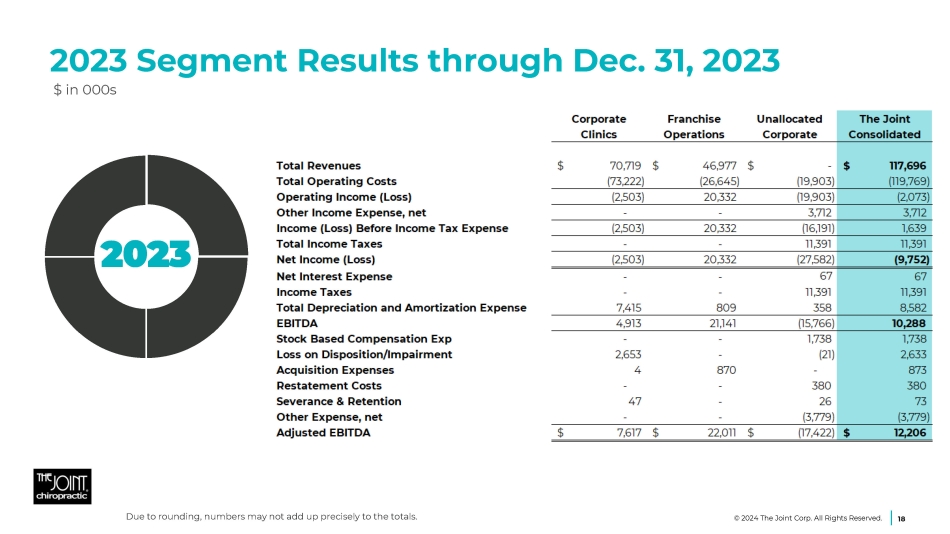
2023 Segment Results through Dec. 31, 2023 $ in 000s 18 2023 © 2024 The Joint Corp. All Rights Reserved. Due to rounding, numbers may not add up precisely to the totals.
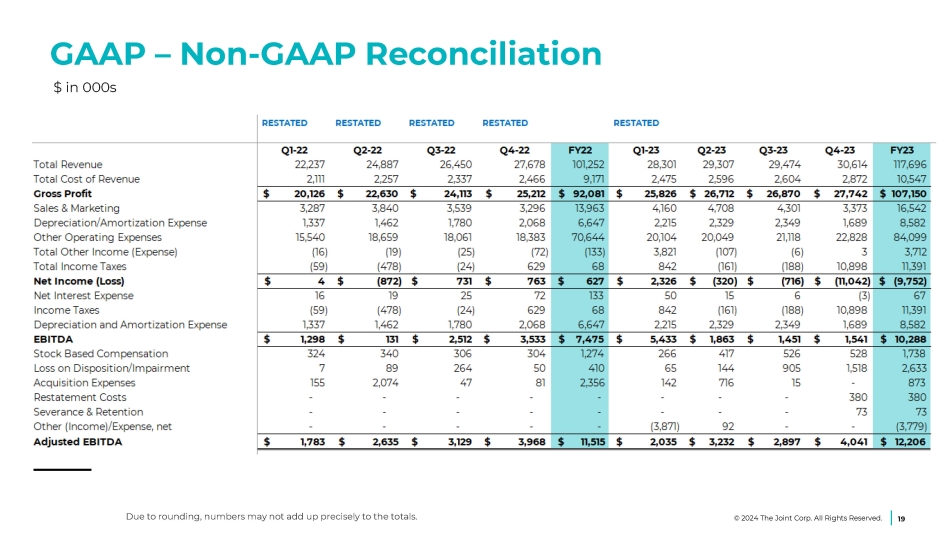
GAAP – Non - GAAP Reconciliation $ in 000s 19 © 2024 The Joint Corp. All Rights Reserved. Due to rounding, numbers may not add up precisely to the totals.

Jake Singleton, CFO [email protected] The Joint Corp. | 16767 N. Perimeter Dr., Suite 110, Scottsdale, AZ 85260 | (480) 245 - 5960 https://www.facebook.com/thejointchiro @thejointchiro https://twitter.com/thejointchiro @thejointchiro https://www.youtube.com/thejointcorp @thejointcorp Peter D. Holt, President & CEO [email protected] The Joint Corp. | 16767 N. Perimeter Dr., Suite 110, Scottsdale, AZ 85260 | (480) 245 - 5960 Kirsten Chapman, LHA Investor Relations [email protected] LHA Investor Relations | 50 California Street, Suite 1500 | San Francisco, CA 94111| (415) 433 - 3777 Contact Information 20 © 2024 The Joint Corp. All Rights Reserved.