
EXHIBIT 99.2
Q3 2023 Financial Results As of September 30, 2023 | Reported on November 9, 2023 The Joint Corp. | NASDAQ: JYNT | thejoint.com EXHIBIT 99.2
Safe Harbor Statements © 2023 The Joint Corp. All Rights Reserved. 2 Certain statements contained in this presentation are "forward - looking statements” about future events and expectations. Forward - looking statements are based on our beliefs, assumptions and expectations of industry trends, our future financial and operating performance and our growth plans, taking into account the information currently available to us. These statements are not statements of historical fact. Words such as, "anticipates," "believes," "continues," "estimates," "expects," "goal," "objectives," "intends," "may," "opportunity," "plans," "potential," "near - term," "long - term," "projections," "assumptions," "projects," "guidance," "forecasts," "outlook," "target," "trends," "should," "could," "would," "will," and similar expressions are intended to identify such forward - looking statements. . Specific forward looking statements made in this press release include, among others, our belief that the strength of our franchise concept to revolutionize access to chiropractic care remains strong; our strategic plan to leverage our biggest strength – our profound understanding of franchising – to drive long - term growth for both our franchisees and The Joint as a public company; our plan to refranchise or sell the majority of our company - owned or managed clinics and to retain a portion of the high - performing corporate clinics; our belief that with a focus on profitability, we are taking clear action to strengthen the health of our network, improve the performance of our public company, and increase our ability to reinvest in the business and create value for our stockholders; and our guidance for fiscal 2023 for revenue, adjusted EBITDA, franchised clinic openings, and company - owned or managed greenfield clinic openings. Forward - looking statements involve risks and uncertainties that may cause our actual results to differ materially from the expectations of future results we express or imply in any forward - looking statements, and you should not place undue reliance on such statements. Factors that could contribute to these differences include, but are not limited to, our inability to identify and recruit enough qualified chiropractors and other personnel to staff our clinics, due in part to the nationwide labor shortage and an increase in operating expenses due to measures we may need to take to address such shortage; inflation, exacerbated by COVID - 19 and the current war in Ukraine, which has increased our costs and which could otherwise negatively impact our business; the potential for further disruption to our operations and the unpredictable impact on our business of the COVID - 19 outbreak and outbreaks of other contagious diseases; our failure to profitably operate company - owned or managed clinics; short - selling strategies and negative opinions posted on the internet, which could drive down the market price of our common stock and result in class action lawsuits; our failure to remediate future material weaknesses in our internal control over financial reporting, which could negatively impact our ability to accurately report our financial results, prevent fraud, or maintain investor confidence; and other factors described in our filings with the SEC, including in the section entitled “Risk Factors” in our Annual Report on Form 10 - K/A for the year ended December 31, 2022 filed with the SEC on September 26, 2023 and subsequently - filed current and quarterly reports. We qualify any forward - looking statements entirely by these cautionary factors. We assume no obligation to update or revise any forward - looking statements for any reason or to update the reasons actual results could differ materially from those anticipated in these forward - looking statements, even if new information becomes available in the future. Comparisons of results for current and any prior periods are not intended to express any future trends or indications of future performance, unless expressed as such, and should only be viewed as historical data. Business Structure The Joint Corp. is a franchisor of clinics and an operator of clinics in certain states. In Arkansas, California, Colorado, District of Columbia, Florida, Illinois, Kansas, Kentucky, Maryland, Michigan, Minnesota, New Jersey, New York, North Carolina, Oregon, Pennsylvania, Rhode Island, South Dakota, Tennessee, Washington, West Virginia and Wyoming. The Joint Corp. and its franchisees provide management services to affiliated professional chiropractic practices.

© 2023 The Joint Corp. All Rights Reserved. 3
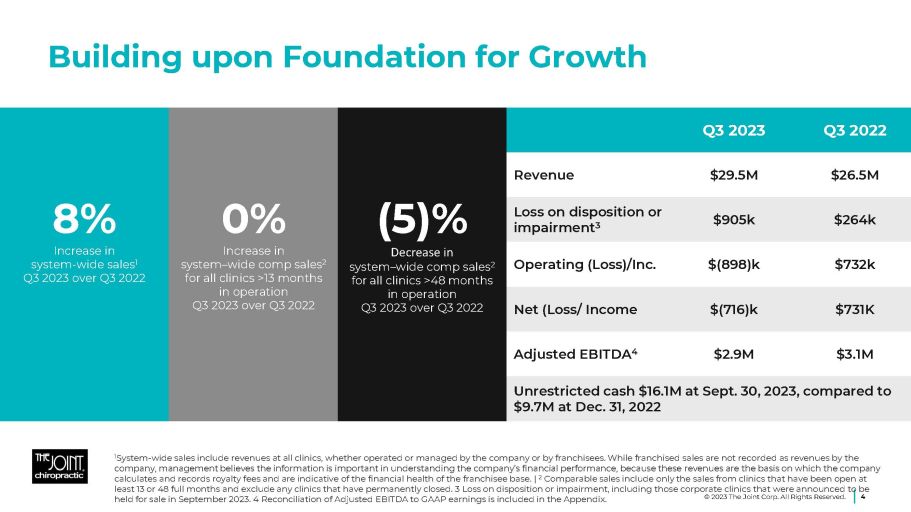
Building upon Foundation for Growth 1 System - wide sales include revenues at all clinics, whether operated or managed by the company or by franchisees. While franchised sales are not recorded as revenues by the company, management believes the information is important in understanding the company’s financial performance, because these revenues are the basis on which the company calculates and records royalty fees and are indicative of the financial health of the franchisee base. | 2 Comparable sales include only the sales from clinics that have been open at least 13 or 48 full months and exclude any clinics that have permanently closed. 3 Loss on disposition or impairment, including those corporate clinics that were announced to be held for sale in September 2023. 4 Reconciliation of Adjusted EBITDA to GAAP earnings is included in the Appendix. © 2023 The Joint Corp. All Rights Reserved. 4 8% Increase in system - wide sales 1 Q3 2023 over Q3 2022 0% Increase in system – wide comp sales 2 for all clinics >13 months in operation Q3 2023 over Q3 2022 (5)% Decrease in system – wide comp sales 2 for all clinics >48 months in operation Q3 2023 over Q3 2022 Q3 2022 Q3 2023 $26.5M $29.5M Revenue $264k $905k Loss on disposition or impairment 3 $732k $(898)k Operating (Loss)/Inc. $731K $(716)k Net (Loss/ Income $3.1M $2.9M Adjusted EBITDA 4 Unrestricted cash $16.1M at Sept. 30, 2023, compared to $9.7M at Dec. 31, 2022
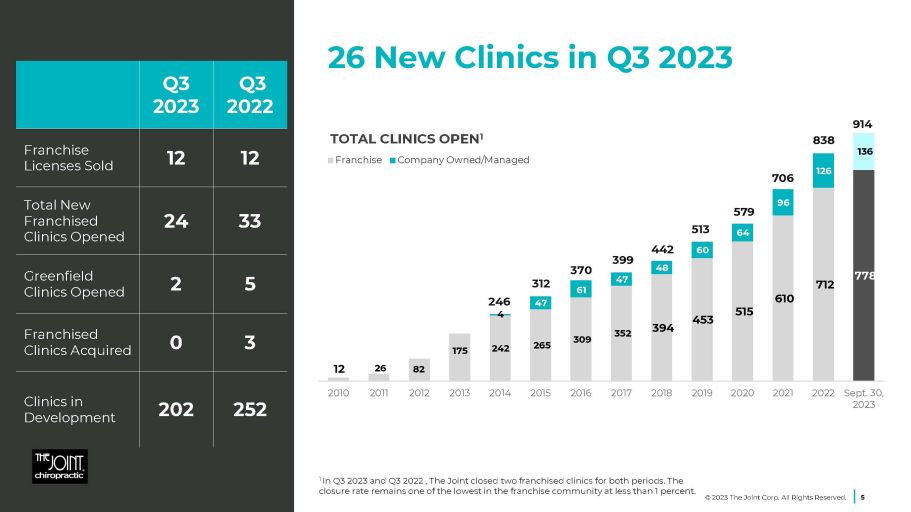
© 2023 The Joint Corp. All Rights Reserved. 5 26 New Clinics in Q3 2023 Q3 2022 Q3 2023 12 12 Franchise Licenses Sold 33 24 Total New Franchised Clinics Opened 5 2 Greenfield Clinics Opened 3 0 Franchised Clinics Acquired 252 202 Clinics in Development 12 26 82 175 242 265 309 352 394 453 515 610 712 778 4 47 61 47 48 60 64 96 126 136 2010 2011 2012 2013 2014 2015 2016 2017 2018 2019 2020 2021 2022 Sept. 30, 2023 TOTAL CLINICS OPEN 1 Franchise Company Owned/Managed 1 In Q3 2023 and Q3 2022 , The Joint closed two franchised clinics for both periods. The closure rate remains one of the lowest in the franchise community at less than 1 percent. 370 399 442 513 312 246 579 706 838 914
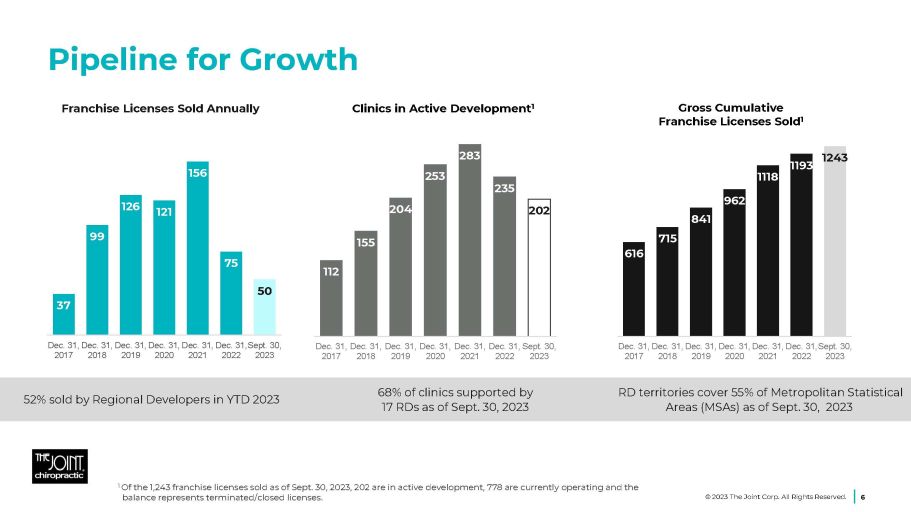
RD territories cover 55% of Metropolitan Statistical Areas (MSAs) as of Sept. 30, 2023 68% of clinics supported by 17 RDs as of Sept. 30, 2023 52% sold by Regional Developers in YTD 2023 37 99 126 121 156 75 50 Dec. 31, Dec. 31, Dec. 31, Dec. 31, Dec. 31, Dec. 31,Sept. 30, 2017 2018 2019 2020 2021 2022 2023 616 715 841 962 1118 1193 1243 Dec. 31, Dec. 31, Dec. 31, Dec. 31, Dec. 31, Dec. 31,Sept. 30, 2017 2018 2019 2020 2021 2022 2023 112 155 204 253 283 235 202 Dec. 31, Dec. 31, Dec. 31, Dec. 31, Dec. 31, Dec. 31, Sept. 30, 2017 2018 2019 2020 2021 2022 2023 Pipeline for Growth 6 1 Of the 1,243 franchise licenses sold as of Sept. 30, 2023, 202 are in active development, 778 are currently operating and the balance represents terminated/closed licenses. Gross Cumulative Franchise Licenses Sold 1 Franchise Licenses Sold Annually Clinics in Active Development 1 © 2023 The Joint Corp. All Rights Reserved.
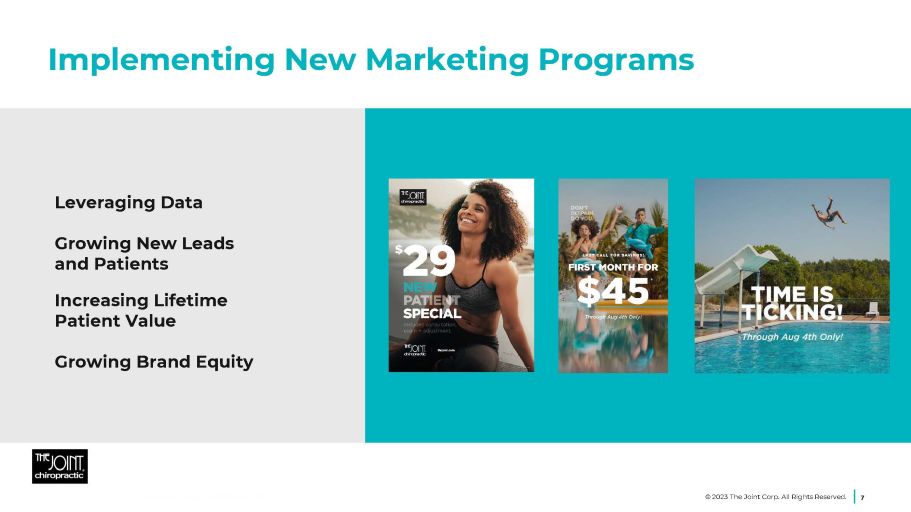
Implementing New Marketing Programs 7 Leveraging Data Growing New Leads and Patients Increasing Lifetime Patient Value Growing Brand Equity © 2023 The Joint Corp. All Rights Reserved.
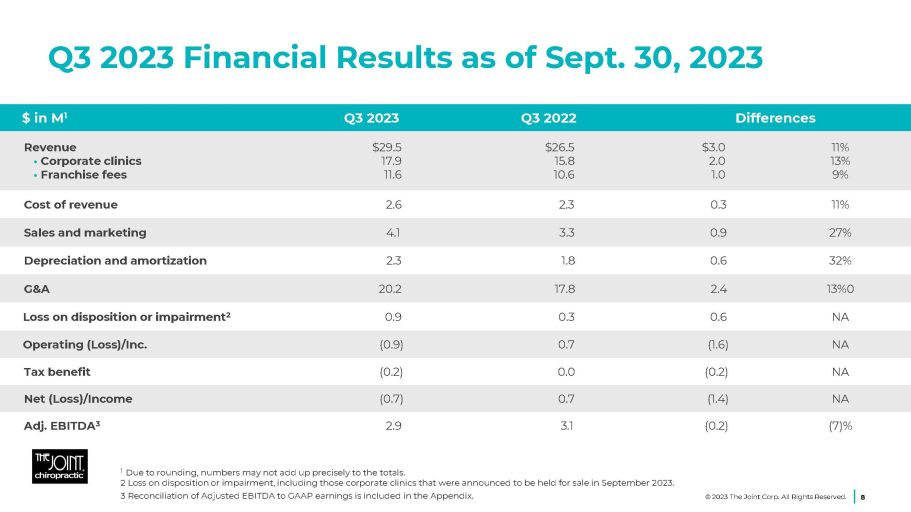
Q3 2023 Financial Results as of Sept. 30, 2023 1 Due to rounding, numbers may not add up precisely to the totals. 2 Loss on disposition or impairment, including those corporate clinics that were announced to be held for sale in September 2023. 3 Reconciliation of Adjusted EBITDA to GAAP earnings is included in the Appendix. © 2023 The Joint Corp. All Rights Reserved. 8 Differences Q3 2022 Q3 2023 $ in M 1 11% 13% 9% $3.0 2.0 1.0 $26.5 15.8 10.6 $29.5 17.9 11.6 Revenue • Corporate clinics • Franchise fees 11% 0.3 2.3 2.6 Cost of revenue 27% 0.9 3.3 4.1 Sales and marketing 32% 0.6 1.8 2.3 Depreciation and amortization 13%0 2.4 17.8 20.2 G&A NA 0.6 0.3 0.9 Loss on disposition or impairment 2 NA (1.6) 0.7 (0.9) Operating (Loss)/Inc. NA (0.2) 0.0 (0.2) Tax benefit NA (1.4) 0.7 (0.7) Net (Loss)/Income (7)% (0.2) 3.1 2.9 Adj. EBITDA 3
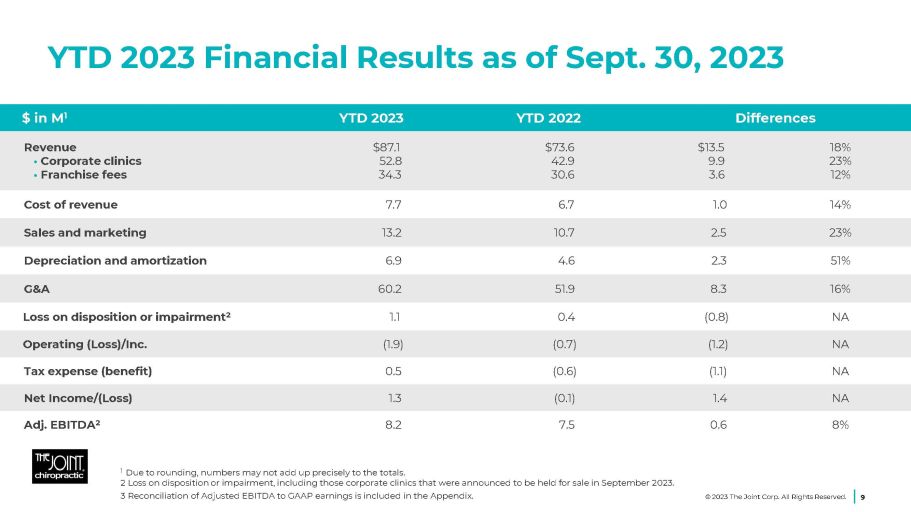
YTD 2023 Financial Results as of Sept. 30, 2023 1 Due to rounding, numbers may not add up precisely to the totals. 2 Loss on disposition or impairment, including those corporate clinics that were announced to be held for sale in September 2023. 3 Reconciliation of Adjusted EBITDA to GAAP earnings is included in the Appendix. © 2023 The Joint Corp. All Rights Reserved. 9 Differences YTD 2022 YTD 2023 $ in M 1 18% 23% 12% $13.5 9.9 3.6 $73.6 42.9 30.6 $87.1 52.8 34.3 Revenue • Corporate clinics • Franchise fees 14% 1.0 6.7 7.7 Cost of revenue 23% 2.5 10.7 13.2 Sales and marketing 51% 2.3 4.6 6.9 Depreciation and amortization 16% 8.3 51.9 60.2 G&A NA (0.8) 0.4 1.1 Loss on disposition or impairment 2 NA (1.2) (0.7) (1.9) Operating (Loss)/Inc. NA (1.1) (0.6) 0.5 Tax expense (benefit) NA 1.4 (0.1) 1.3 Net Income/(Loss) 8% 0.6 7.5 8.2 Adj. EBITDA 2
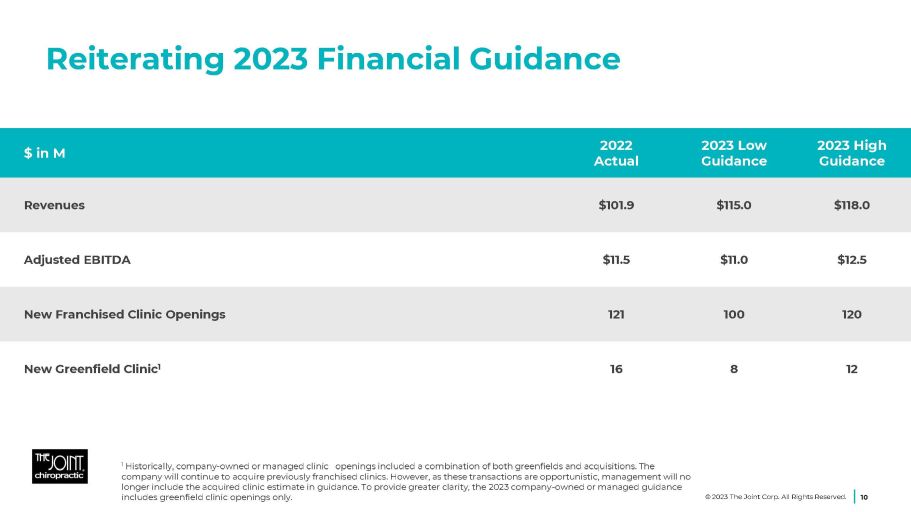
1 Historically, company - owned or managed clinic openings included a combination of both greenfields and acquisitions. The company will continue to acquire previously franchised clinics. However, as these transactions are opportunistic, management will no longer include the acquired clinic estimate in guidance. To provide greater clarity, the 2023 company - owned or managed guidance includes greenfield clinic openings only. Reiterating 2023 Financial Guidance 10 2023 High Guidance 2023 Low Guidance 2022 Actual $ in M $118.0 $115.0 $101.9 Revenues $12.5 $11.0 $11.5 Adjusted EBITDA 120 100 121 New Franchised Clinic Openings 12 8 16 New Greenfield Clinic 1 © 2023 The Joint Corp. All Rights Reserved.
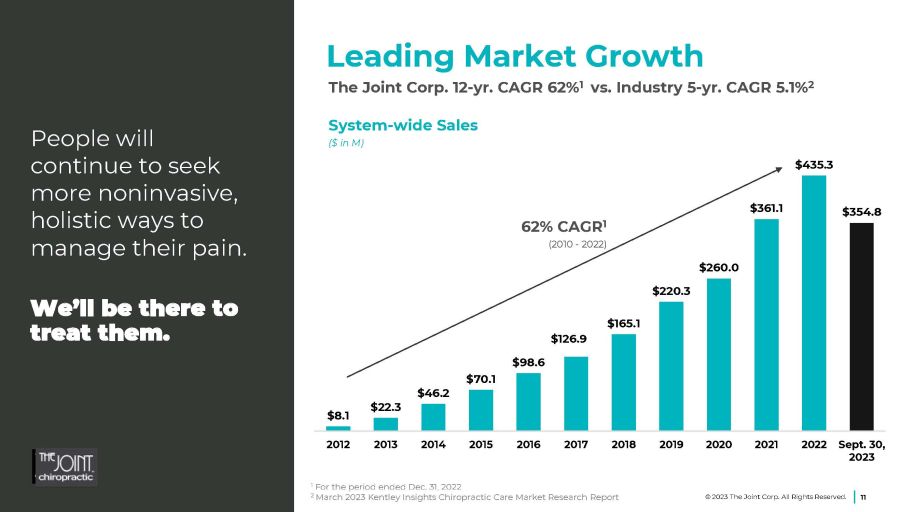
Leading Market Growth The Joint Corp. 12 - yr. CAGR 62% 1 vs. Industry 5 - yr. CAGR 5.1% 2 People will continue to seek more noninvasive, holistic ways to manage their pain. We’ll be there to treat them. 1 For the period ended Dec. 31, 2022 2 March 2023 Kentley Insights Chiropractic Care Market Research Report 11 © 2023 The Joint Corp. All Rights Reserved. System - wide Sales ($ in M) 62% CAGR 1 (2010 - 2022) $8.1 $22.3 $98.6 $70.1 $46.2 $126.9 $165.1 $260.0 $220.3 $361.1 $435.3 $354.8 2012 2013 2014 2015 2016 2017 2018 2019 2020 2021 2022 Sept. 30, 2023
Driving Long - term Shareholder Value The most powerful brand - building tool is our storefronts . © 2023 The Joint Corp. All Rights Reserved. 12
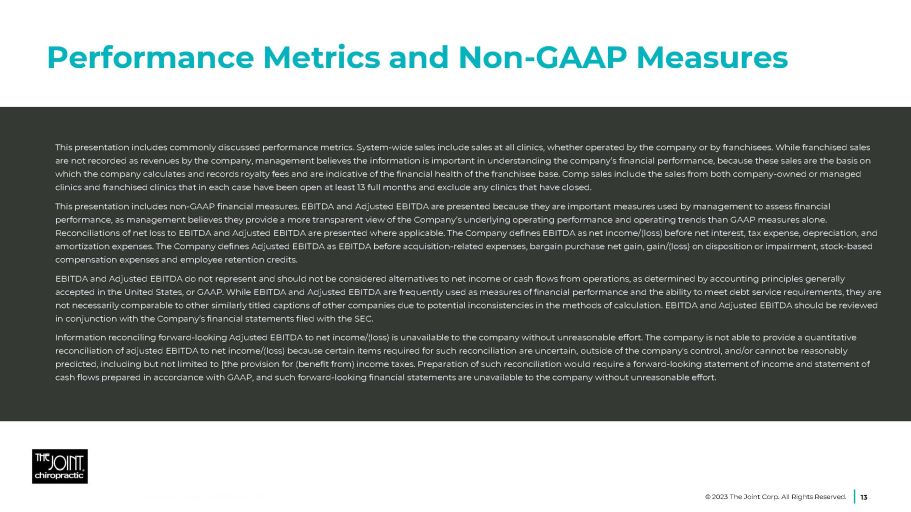
Performance Metrics and Non - GAAP Measures © 2023 The Joint Corp. All Rights Reserved. 13 This presentation includes commonly discussed performance metrics. System - wide sales include sales at all clinics, whether operated by the company or by franchisees. While franchised sales are not recorded as revenues by the company, management believes the information is important in understanding the company’s financial performance, because these sales are the basis on which the company calculates and records royalty fees and are indicative of the financial health of the franchisee base. Comp sales include the sales from both company - owned or managed clinics and franchised clinics that in each case have been open at least 13 full months and exclude any clinics that have closed. This presentation includes non - GAAP financial measures. EBITDA and Adjusted EBITDA are presented because they are important measures used by management to assess financial performance, as management believes they provide a more transparent view of the Company’s underlying operating performance and operating trends than GAAP measures alone. Reconciliations of net loss to EBITDA and Adjusted EBITDA are presented where applicable. The Company defines EBITDA as net income/(loss) before net interest, tax expense, depreciation, and amortization expenses. The Company defines Adjusted EBITDA as EBITDA before acquisition - related expenses, bargain purchase net gain, gain/(loss) on disposition or impairment, stock - based compensation expenses and employee retention credits. EBITDA and Adjusted EBITDA do not represent and should not be considered alternatives to net income or cash flows from operations, as determined by accounting principles generally accepted in the United States, or GAAP. While EBITDA and Adjusted EBITDA are frequently used as measures of financial performance and the ability to meet debt service requirements, they are not necessarily comparable to other similarly titled captions of other companies due to potential inconsistencies in the methods of calculation. EBITDA and Adjusted EBITDA should be reviewed in conjunction with the Company’s financial statements filed with the SEC. Information reconciling forward - looking Adjusted EBITDA to net income/(loss) is unavailable to the company without unreasonable effort. The company is not able to provide a quantitative reconciliation of adjusted EBITDA to net income/(loss) because certain items required for such reconciliation are uncertain, outside of the company's control, and/or cannot be reasonably predicted, including but not limited to [the provision for (benefit from) income taxes. Preparation of such reconciliation would require a forward - looking statement of income and statement of cash flows prepared in accordance with GAAP, and such forward - looking financial statements are unavailable to the company without unreasonable effort.
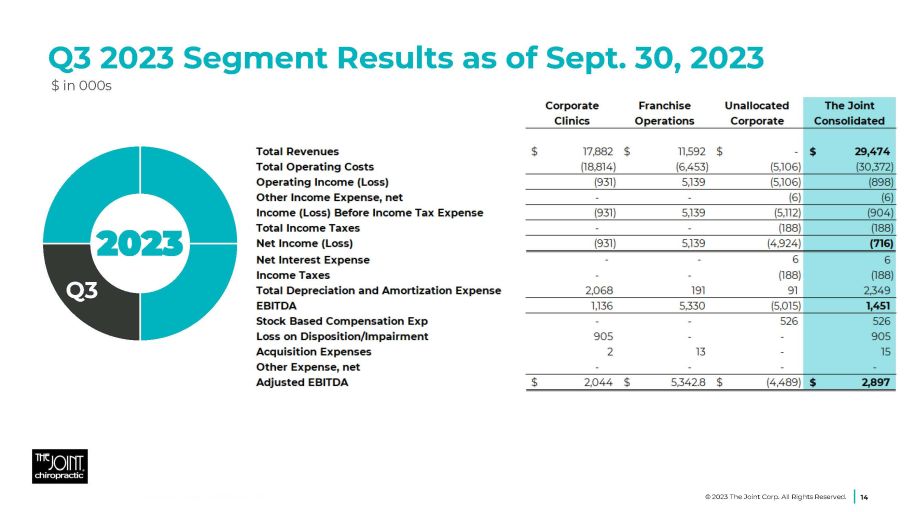
Q3 2023 Segment Results as of Sept. 30, 2023 $ in 000s 2023 Q3 © 2023 The Joint Corp. All Rights Reserved. 14
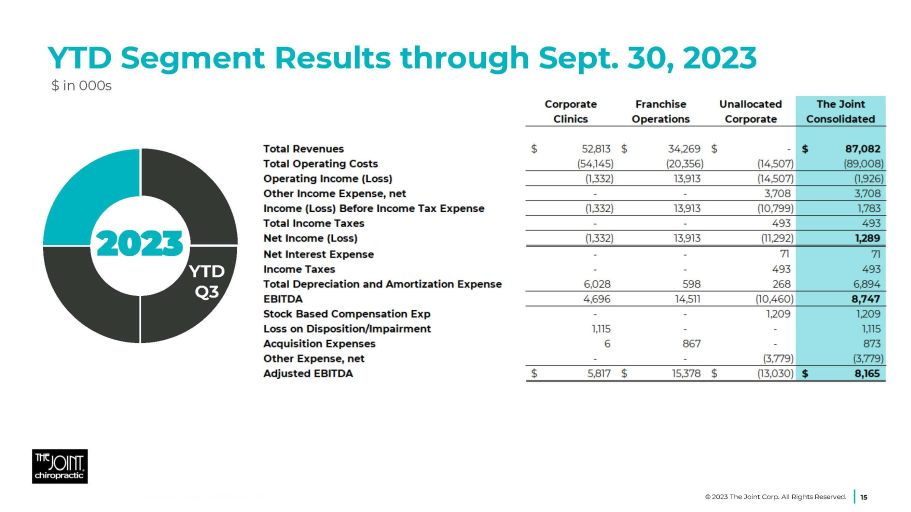
YTD Segment Results through Sept. 30, 2023 $ in 000s 2023 YTD Q3 © 2023 The Joint Corp. All Rights Reserved. 15
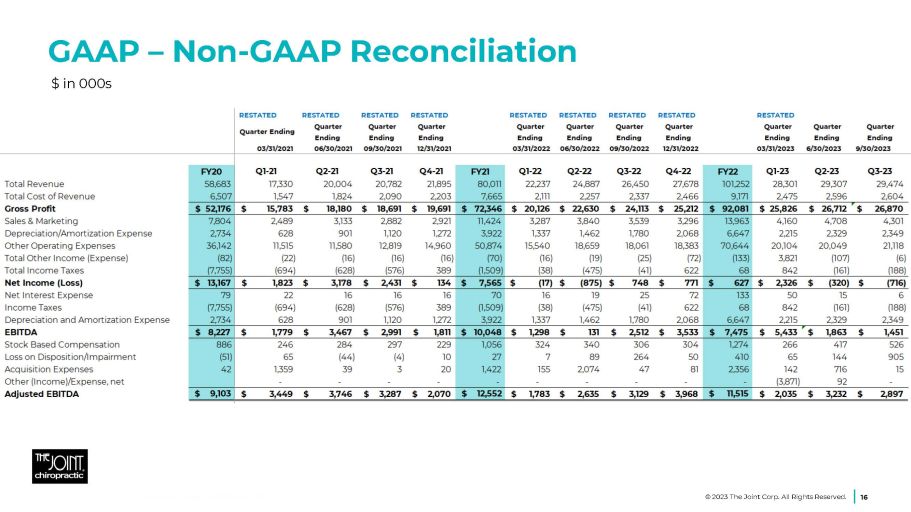
GAAP – Non - GAAP Reconciliation $ in 000s © 2023 The Joint Corp. All Rights Reserved. 16

Jake Singleton, CFO [email protected] The Joint Corp. | 16767 N. Perimeter Dr., Suite 110, Scottsdale, AZ 85260 | (480) 245 - 5960 https://www.facebook.com/thejointchiro @thejointchiro © 2023 The Joint Corp. All Rights Reserved. 17 https://twitter.com/thejointchiro @thejointchiro https://www.youtube.com/thejointcorp @thejointcorp Peter D. Holt, President & CEO [email protected] The Joint Corp. | 16767 N. Perimeter Dr., Suite 110, Scottsdale, AZ 85260 | (480) 245 - 5960 Kirsten Chapman, LHA Investor Relations [email protected] LHA Investor Relations | 50 California Street, Suite 1500 | San Francisco, CA 94111| (415) 433 - 3777 Contact Information