
Exhibit 99.2
Preliminary Q2 2023 Investor Presentation As of June 30, 2023 | Reported on September 13, 2023 The Joint Corp. | NASDAQ: JYNT | thejoint.com

Safe Harbor Statements © 2023 The Joint Corp. All Rights Reserved. 2 Certain statements contained in this presentation are "forward - looking statements” about future events and expectations. Forward - looking statements are based on our beliefs, assumptions and expectations of industry trends, our future financial and operating performance and our growth plans, taking into account the information currently available to us. These statements are not statements of historical fact. Forward - looking statements involve risks and uncertainties that may cause our actual results to differ materially from the expectations of future results we express or imply in any forward - looking statements, and you should not place undue reliance on such statements. Factors that could contribute to these differences include, but are not limited to, our preliminary results differing from final results, possible negative effects of the restatement of our financial statements for 2021 and 2022 on our financial position, results of operations and cash flows, increases in our borrowing costs under our credit facility, given that borrowings under the credit facility bear interest at rates tied to certain rising benchmark interest rates; state laws limiting the use our business model, including prohibitions on advance payment for chiropractic services, which recently caused us to elect not to offer franchises in South Dakota and Wyoming; increased costs to comply with a new SEC reporting rule enhancing and standardizing disclosures regarding cybersecurity incidents and cybersecurity risk management, inability to identify and recruit enough qualified chiropractors and other personnel to staff our clinics, due in part to the nationwide labor shortage, an increase in operating expenses due to measures we may need to take to address such shortage, inflation, exacerbated by COVID - 19 and the current war in Ukraine, which has increased our costs and which could otherwise negatively impact our business, the potential for further disruption to our operations and the unpredictable impact on our business of the COVID - 19 outbreak and outbreaks of other contagious diseases, our failure to develop or acquire company - owned or managed clinics as rapidly as we intend, our failure to profitably operate company - owned or managed clinics, short - selling strategies and negative opinions posted on the internet which could drive down the market price of our common stock and result in class action lawsuits, our failure to remediate any material weaknesses in our internal control over financial reporting, which could negatively impact our ability to accurately report our financial results, prevent fraud, or maintain investor confidence, and other factors described in our filings with the SEC, including in the section entitled “Risk Factors” in our Annual Report on Form 10 - K for the year ended December 31, 2022 filed with the SEC on March 10, 2023 and subsequently - filed current and quarterly reports. Words such as, "anticipates," "believes," "continues," "estimates," "expects," "goal," "objectives," "intends," "may," "opportunity," "plans," "potential," "near - term," "long - term," "projections," "assumptions," "projects," "guidance," "forecasts," "outlook," "target," "trends," "should," "could," "would," "will," and similar expressions are intended to identify such forward - looking statements. We qualify any forward - looking statements entirely by these cautionary factors. We assume no obligation to update or revise any forward - looking statements for any reason or to update the reasons actual results could differ materially from those anticipated in these forward - looking statements, even if new information becomes available in the future. Comparisons of results for current and any prior periods are not intended to express any future trends or indications of future performance, unless expressed as such, and should only be viewed as historical data. Business Structure The Joint Corp. is a franchisor of clinics and an operator of clinics in certain states. In Arkansas, California, Colorado, District of Columbia, Florida, Illinois, Kansas, Kentucky, Maryland, Michigan, Minnesota, New Jersey, New York, North Carolina, Oregon, Pennsylvania, Rhode Island, South Dakota, Tennessee, Washington, West Virginia and Wyoming, The Joint Corp. and its franchisees provide management services to affiliated professional chiropractic practices.
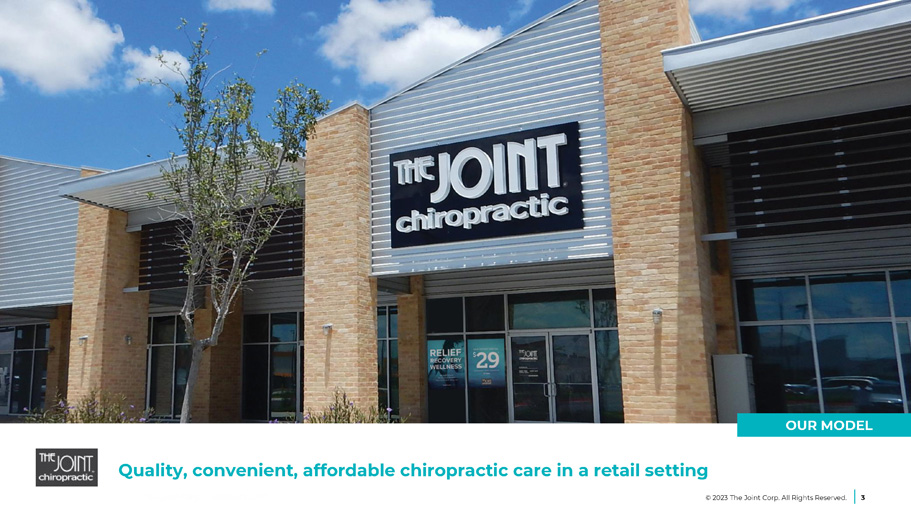
OUR MODEL © 2023 The Joint Corp. All Rights Reserved. 3 Quality, convenient, affordable chiropractic care in a retail setting

OUR STAFF Serving patients seeking pain relief and ongoing health and wellness © 2023 The Joint Corp. All Rights Reserved. 4
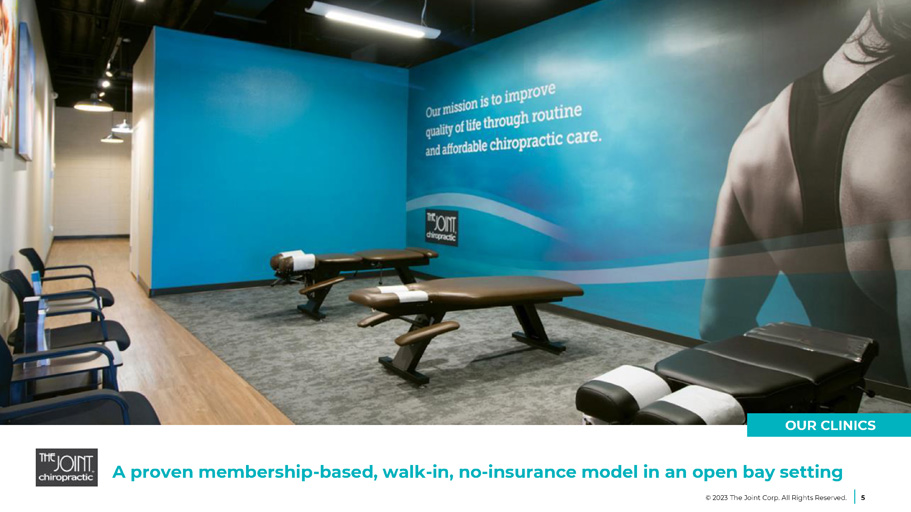
OUR CLINICS A proven membership - based, walk - in, no - insurance model in an open bay setting © 2023 The Joint Corp. All Rights Reserved. 5
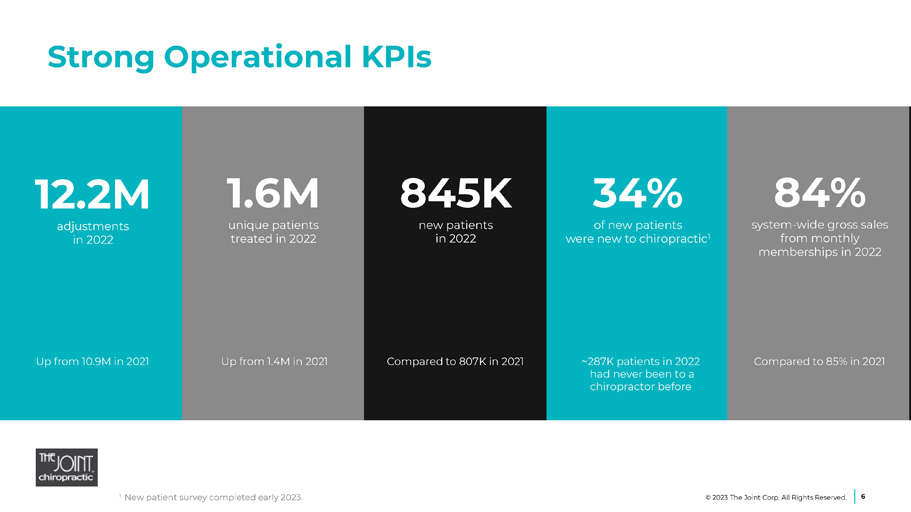
Strong Operational KPIs 6 1 New patient survey completed early 2023. 1.6M unique patients treated in 2022 845K new patients in 2022 12.2M adjustments in 2022 34% of new patients were new to chiropractic 1 84% system - wide gross sales from monthly memberships in 2022 Up from 1.4M in 2021 ~287K patients in 2022 had never been to a chiropractor before Compared to 807K in 2021 Up from 10.9M in 2021 Compared to 85% in 2021 © 2023 The Joint Corp. All Rights Reserved.
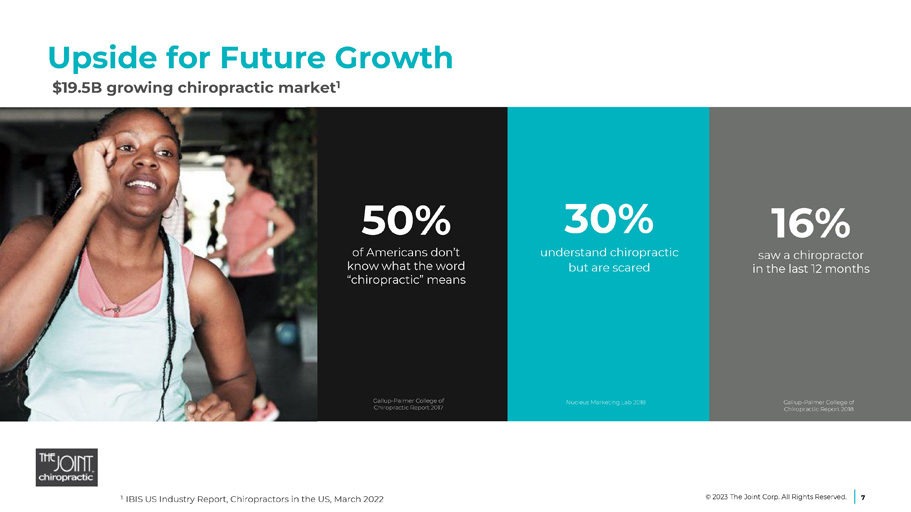
Upside for Future Growth $19.5B growing chiropractic market 1 7 50% of Americans don’t know what the word “chiropractic” means 16% saw a chiropractor in the last 12 months 30% understand chiropractic but are scared Gallup - Palmer College of Chiropractic Report 2017 Gallup - Palmer College of Chiropractic Report 2018 Nucleus Marketing Lab 2018 1 IBIS US Industry Report, Chiropractors in the US, March 2022 © 2023 The Joint Corp. All Rights Reserved.
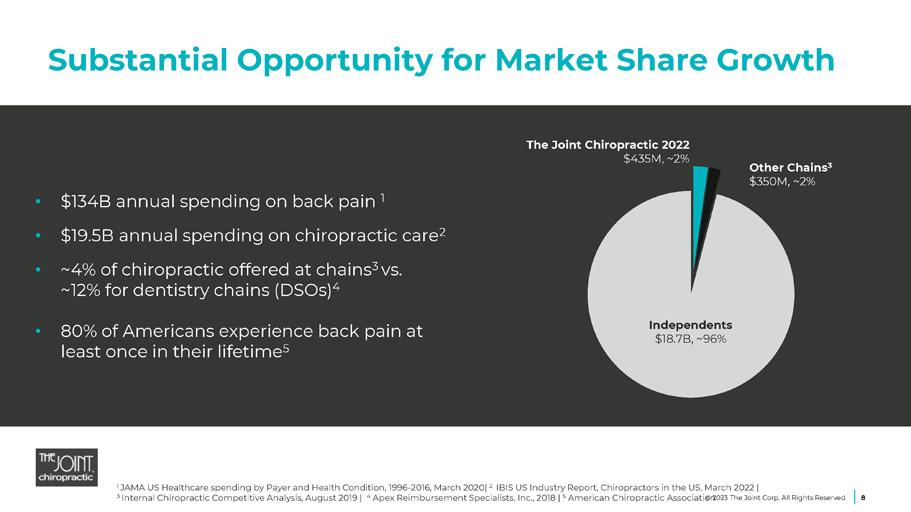
Substantial Opportunity for Market Share Growth 1 JAMA US Healthcare spending by Payer and Health Condition, 1996 - 2016, March 2020| 2 IBIS US Industry Report, Chiropractors in the US, March 2022 | 3 Internal Chiropractic Competitive Analysis, August 2019 | 4 Apex Reimbursement Specialists, Inc., 2018 | 5 American Chiropractic Asso c i a t i o © n 2 0 23 The Joint Corp. All Rights Reserved. 8 • $134B annual spending on back pain 1 • $19.5B annual spending on chiropractic care 2 • ~4% of chiropractic offered at chains 3 vs. ~12% for dentistry chains (DSOs) 4 • 80% of Americans experience back pain at least once in their lifetime 5 The Joint Chiropractic 2022 $435M, ~2% Other Chains 3 $350M, ~2% Independents $18.7B, ~96%

Only 4.9% of Franchise Concepts Have 500+ Units © 2023 The Joint Corp. All Rights Reserved. 9 Source: FRANdata Percentage of Franchise Brands by # of Units Only 94 brands have over 1000 units. 2.14% 500 - 1000 units 2.72% 1000+ units 14.90% 101 - 500 units 10.65% 51 - 100 units 35.04% 5 - 50 units 34.55% <4 units
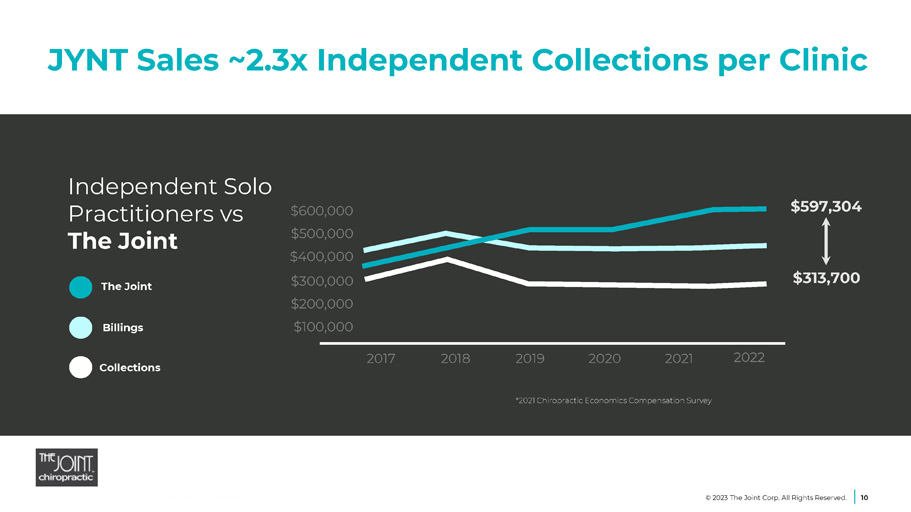
JYNT Sales ~2.3x Independent Collections per Clinic Independent Solo Practitioners vs The Joint The Joint Billings Collections *2021 Chiropractic Economics Compensation Survey $600,000 $500,000 $400,000 $300,000 $200,000 $100,000 2017 2018 2019 2020 2021 $597,304 $313,700 2022 © 2023 The Joint Corp. All Rights Reserved. 10
Top Franchise Recognition... Again © 2023 The Joint Corp. All Rights Reserved. 11
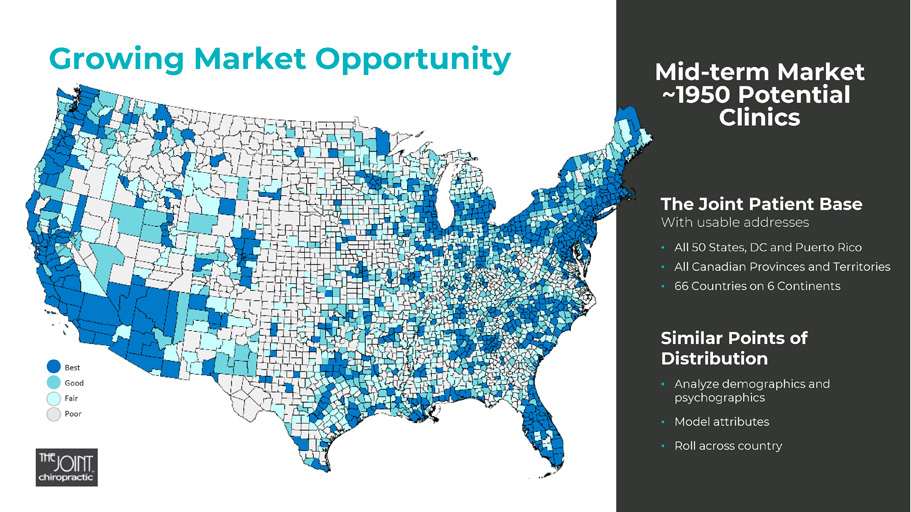
Best Good Fair Poor The Joint Patient Base With usable addresses • All 50 States, DC and Puerto Rico • All Canadian Provinces and Territories • 66 Countries on 6 Continents Similar Points of Distribution • Analyze demographics and psychographics • Model attributes • Roll across country Mid - term Market ~1950 Potential Clinics Growing Market Opportunity
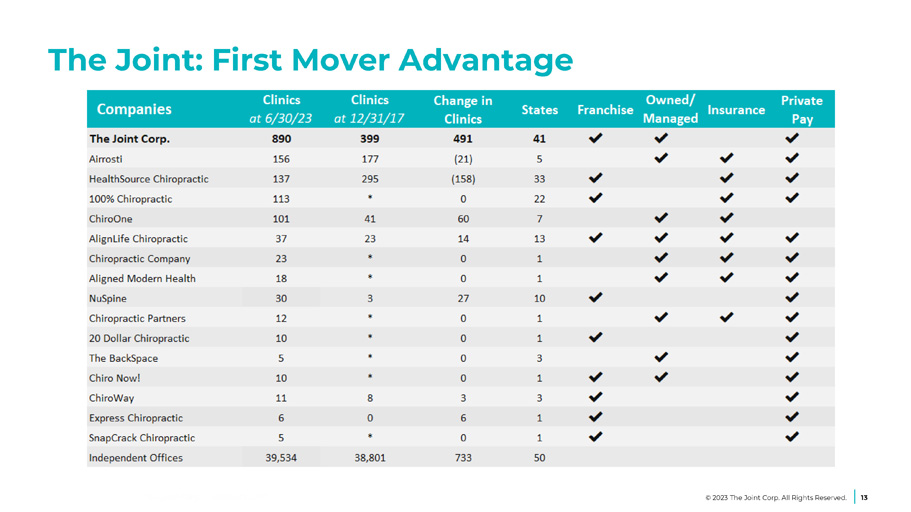
The Joint: First Mover Advantage 13 © 2023 The Joint Corp. All Rights Reserved.
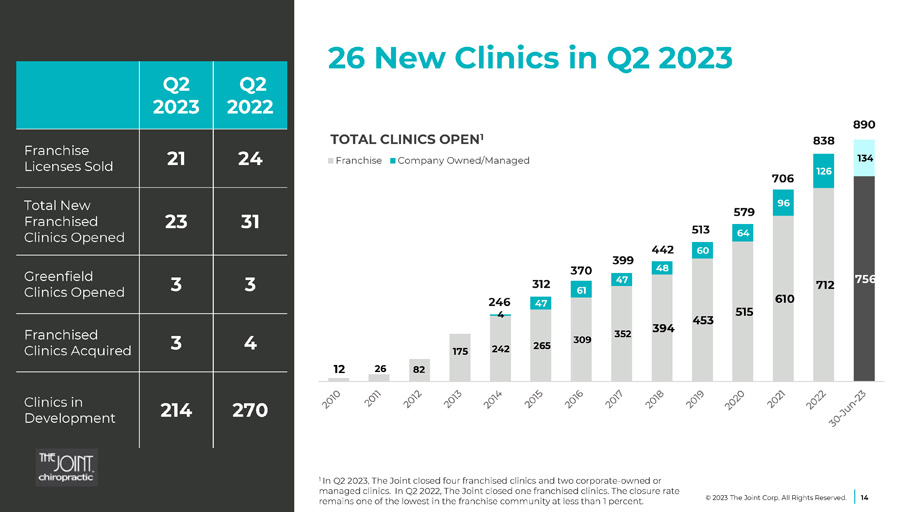
© 2023 The Joint Corp. All Rights Reserved. 14 26 New Clinics in Q2 2023 Q2 2022 Q2 2023 24 21 Franchise Licenses Sold 31 23 Total New Franchised Clinics Opened 3 3 Greenfield Clinics Opened 4 3 Franchised Clinics Acquired 270 214 Clinics in Development 12 26 82 175 242 265 309 352 394 453 515 610 712 756 4 47 61 47 48 60 64 96 126 134 TOTAL CLINICS OPEN 1 Franchise Company Owned/Managed 1 In Q2 2023, The Joint closed four franchised clinics and two corporate - owned or managed clinics. In Q2 2022, The Joint closed one franchised clinics. The closure rate remains one of the lowest in the franchise community at less than 1 percent. 370 399 442 513 312 246 579 706 838 890
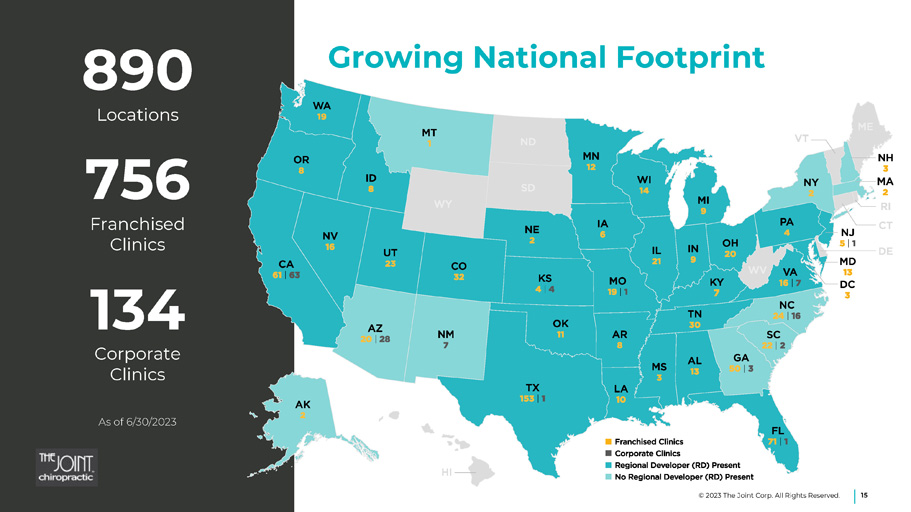
15 890 Locations 756 Franchised Clinics 134 Corporate Clinics Growing National Footprint As of 6/30/2023 © 2023 The Joint Corp. All Rights Reserved.
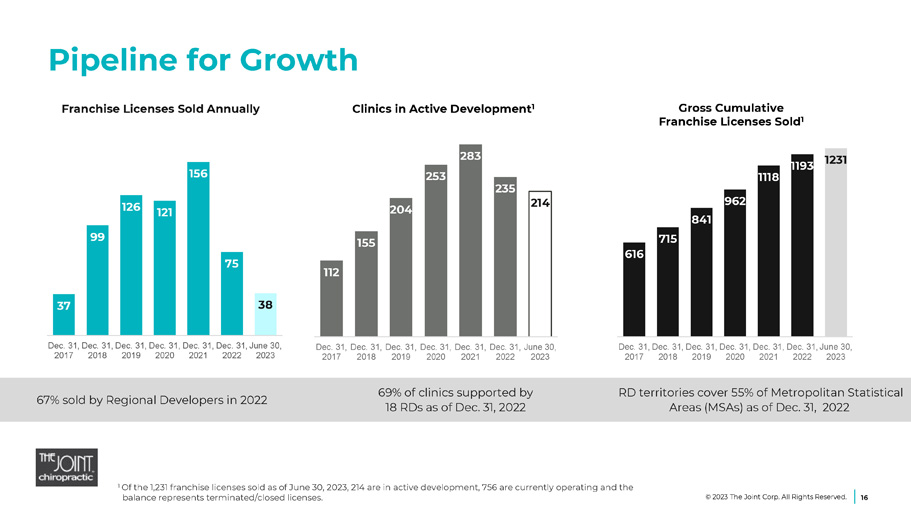
RD territories cover 55% of Metropolitan Statistical Areas (MSAs) as of Dec. 31, 2022 69% of clinics supported by 18 RDs as of Dec. 31, 2022 67% sold by Regional Developers in 2022 37 99 126 121 156 75 38 Dec. 31, Dec. 31, Dec. 31, Dec. 31, Dec. 31, Dec. 31, June 30, 2017 2018 2019 2020 2021 2022 2023 616 715 841 962 1118 1193 1231 Dec. 31, Dec. 31, Dec. 31, Dec. 31, Dec. 31, Dec. 31, June 30, 2017 2018 2019 2020 2021 2022 2023 112 155 204 253 283 235 214 Dec. 31, Dec. 31, Dec. 31, Dec. 31, Dec. 31, Dec. 31, June 30, 2017 2018 2019 2020 2021 2022 2023 Pipeline for Growth 16 1 Of the 1,231 franchise licenses sold as of June 30, 2023, 214 are in active development, 756 are currently operating and the balance represents terminated/closed licenses. Gross Cumulative Franchise Licenses Sold 1 Franchise Licenses Sold Annually Clinics in Active Development 1 © 2023 The Joint Corp. All Rights Reserved.
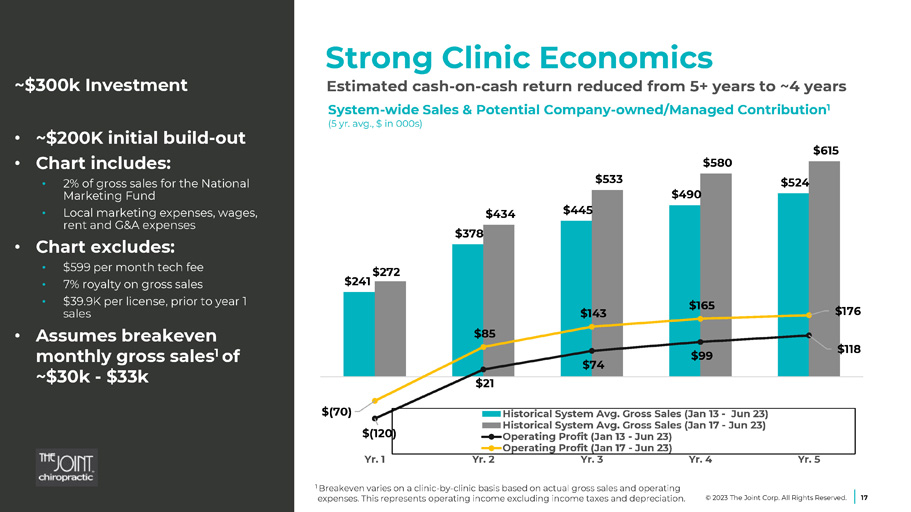
© 2023 The Joint Corp. All Rights Reserved. 17 Strong Clinic Economics ~$300k Investment • ~$200K initial build - out • Chart includes: • 2% of gross sales for the National Marketing Fund • Local marketing expenses, wages, rent and G&A expenses • Chart excludes: • $599 per month tech fee • 7% royalty on gross sales • $39.9K per license, prior to year 1 sales • Assumes breakeven monthly gross sales 1 of ~$30k - $33k 1 Breakeven varies on a clinic - by - clinic basis based on actual gross sales and operating expenses. This represents operating income excluding income taxes and depreciation. Estimated cash - on - cash return reduced from 5+ years to ~4 years System - wide Sales & Potential Company - owned/Managed Contribution 1 (5 yr. avg., $ in 000s) $241 $378 $445 $490 $524 $272 $434 $533 $580 $615 $21 $74 $99 $118 $(70) $85 $143 $165 $176 $(120) Yr. 1 Yr. 2 Yr. 5 Historical System Avg . Gross Sales (Jan 13 - Jun 23 ) Historical System Avg . Gross Sales (Jan 17 - Jun 23 ) Operating Profit (Jan 13 - Jun 23 ) Operating Profit (Jan 17 - Jun 23 ) Yr . 3 Yr . 4
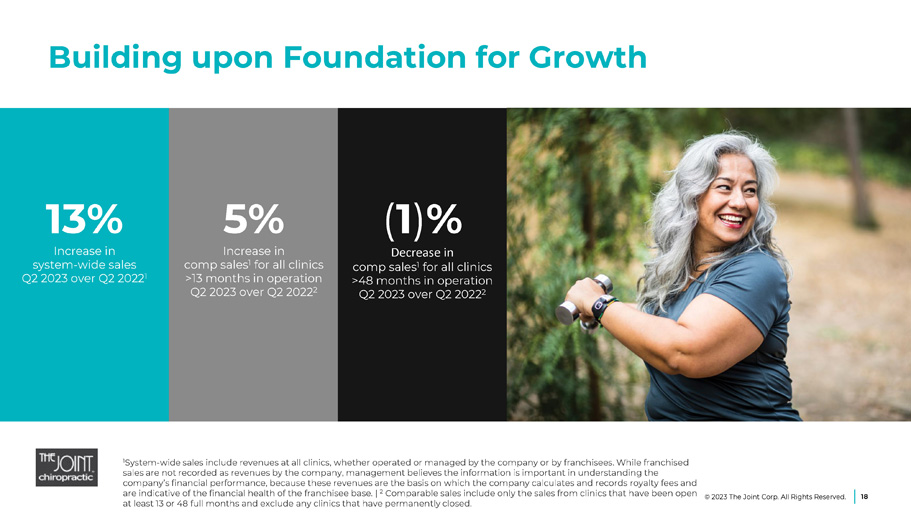
Building upon Foundation for Growth 18 © 2023 The Joint Corp. All Rights Reserved. 13% Increase in system - wide sales Q2 2023 over Q2 2022 1 5% Increase in comp sales 1 for all clinics >13 months in operation Q2 2023 over Q2 2022 2 ( 1 ) % Decrease in comp sales 1 for all clinics >48 months in operation Q2 2023 over Q2 2022 2 1 System - wide sales include revenues at all clinics, whether operated or managed by the company or by franchisees. While franchised sales are not recorded as revenues by the company, management believes the information is important in understanding the company’s financial performance, because these revenues are the basis on which the company calculates and records royalty fees and are indicative of the financial health of the franchisee base. | 2 Comparable sales include only the sales from clinics that have been open at least 13 or 48 full months and exclude any clinics that have permanently closed.
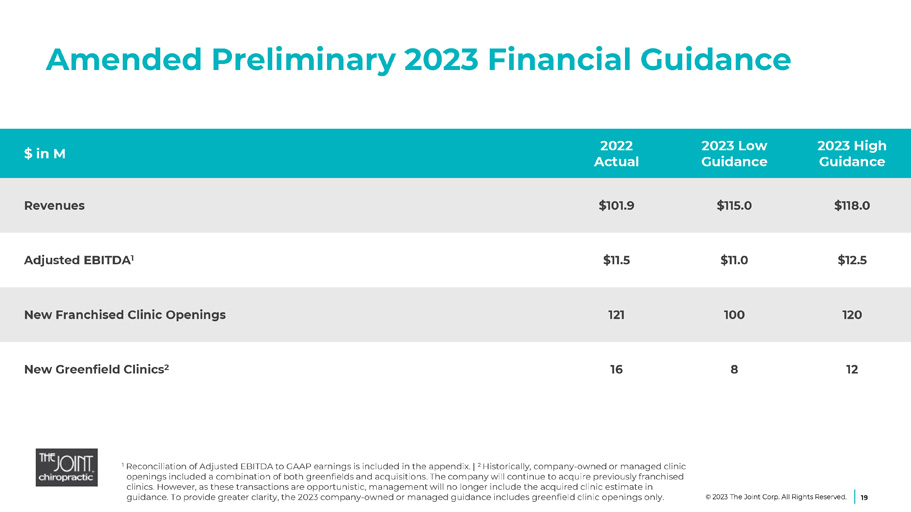
1 Reconciliation of Adjusted EBITDA to GAAP earnings is included in the appendix. | 2 Historically, company - owned or managed clinic openings included a combination of both greenfields and acquisitions. The company will continue to acquire previously franchised clinics. However, as these transactions are opportunistic, management will no longer include the acquired clinic estimate in guidance. To provide greater clarity, the 2023 company - owned or managed guidance includes greenfield clinic openings only. Amended Preliminary 2023 Financial Guidance 19 2023 High Guidance 2023 Low Guidance 2022 Actual $ in M $118.0 $115.0 $101.9 Revenues $12.5 $11.0 $11.5 Adjusted EBITDA 1 120 100 121 New Franchised Clinic Openings 12 8 16 New Greenfield Clinics 2 © 2023 The Joint Corp. All Rights Reserved.
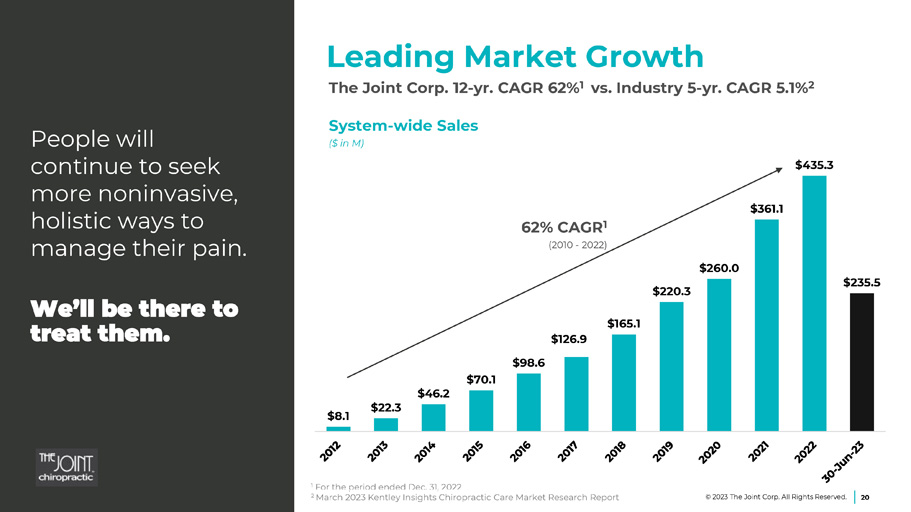
Leading Market Growth The Joint Corp. 12 - yr. CAGR 62% 1 vs. Industry 5 - yr. CAGR 5.1% 2 People will continue to seek more noninvasive, holistic ways to manage their pain. We’ll be there to treat them. 1 For the period ended Dec. 31, 2022 2 March 2023 Kentley Insights Chiropractic Care Market Research Report 20 © 2023 The Joint Corp. All Rights Reserved. System - wide Sales ($ in M) 62% CAGR 1 (2010 - 2022) $8.1 $22.3 $98.6 $70.1 $46.2 $126.9 $165.1 $220.3 $260.0 $361.1 $435.3 $235.5
Driving Long - term Shareholder Value The most powerful brand - building tool is our storefronts . © 2023 The Joint Corp. All Rights Reserved. 21

Appendix © 2023 The Joint Corp. All Rights Reserved. 22
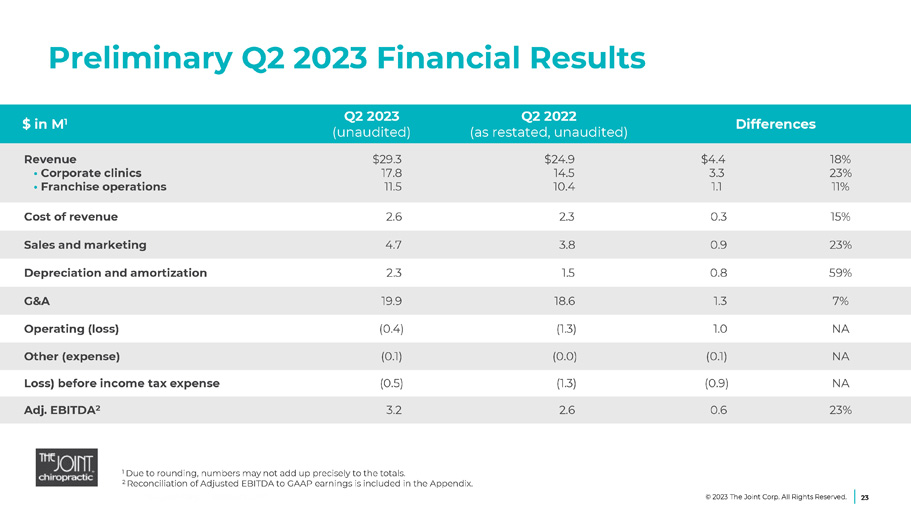
Preliminary Q2 2023 Financial Results © 2023 The Joint Corp. All Rights Reserved. 23 Differences Q2 2022 (as restated, unaudited) Q2 2023 (unaudited) $ in M 1 18% 23% 11% $4.4 3.3 1.1 $24.9 14.5 10.4 $29.3 17.8 11.5 Revenue • Corporate clinics • Franchise operations 15% 0.3 2.3 2.6 Cost of revenue 23% 0.9 3.8 4.7 Sales and marketing 59% 0.8 1.5 2.3 Depreciation and amortization 7% 1.3 18.6 19.9 G&A NA 1.0 (1.3) (0.4) Operating (loss) NA (0.1) (0.0) (0.1) Other (expense) NA (0.9) (1.3) (0.5) Loss) before income tax expense 23% 0.6 2.6 3.2 Adj. EBITDA 2 1 Due to rounding, numbers may not add up precisely to the totals. 2 Reconciliation of Adjusted EBITDA to GAAP earnings is included in the Appendix.
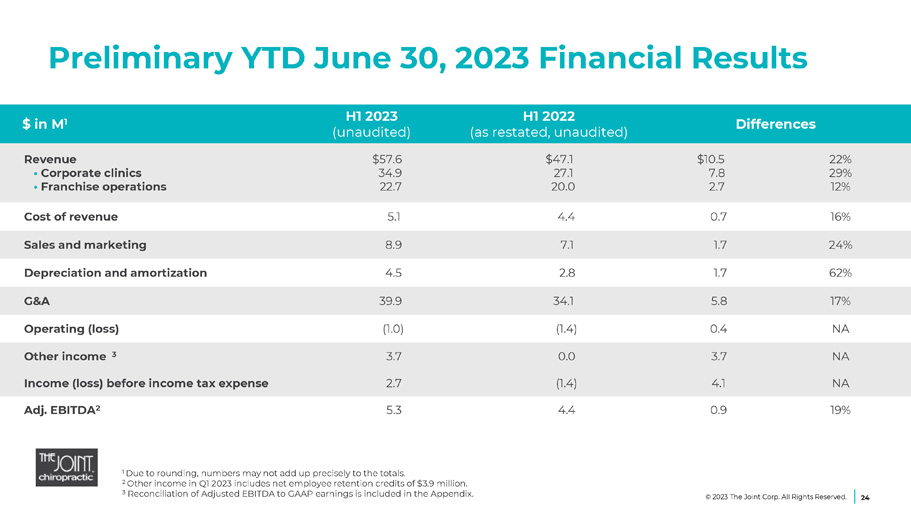
Preliminary YTD June 30, 2023 Financial Results 24 Differences H1 2022 (as restated, unaudited) H1 2023 (unaudited) $ in M 1 22% 29% 12% $10.5 7.8 2.7 $47.1 27.1 20.0 $57.6 34.9 22.7 Revenue • Corporate clinics • Franchise operations 16% 0.7 4.4 5.1 Cost of revenue 24% 1.7 7.1 8.9 Sales and marketing 62% 1.7 2.8 4.5 Depreciation and amortization 17% 5.8 34.1 39.9 G&A NA 0.4 (1.4) (1.0) Operating (loss) NA 3.7 0.0 3.7 Other income 3 NA 4.1 (1.4) 2.7 Income (loss) before income tax expense 19% 0.9 4.4 5.3 Adj. EBITDA 2 © 2023 The Joint Corp. All Rights Reserved. 1 Due to rounding, numbers may not add up precisely to the totals. 2 Other income in Q1 2023 includes net employee retention credits of $3.9 million. 3 Reconciliation of Adjusted EBITDA to GAAP earnings is included in the Appendix.
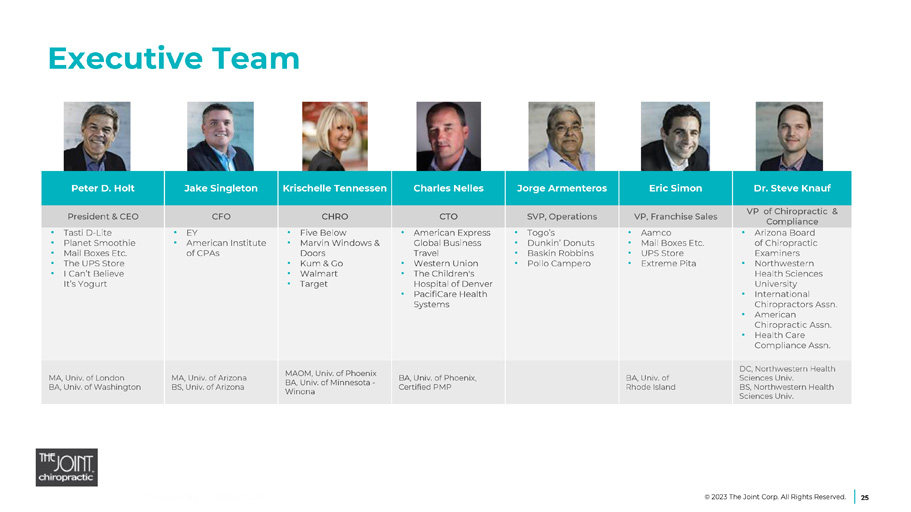
25 Executive Team Dr. Steve Knauf Eric Simon Jorge Armenteros Charles Nelles Krischelle Tennessen Jake Singleton Peter D. Holt VP of Chiropractic & Compliance VP, Franchise Sales SVP, Operations CTO CHRO CFO President & CEO • Arizona Board of Chiropractic Examiners • Northwestern Health Sciences University • International Chiropractors Assn. • American Chiropractic Assn. • Health Care Compliance Assn. • Aamco • Mail Boxes Etc. • UPS Store • Extreme Pita • Togo’s • Dunkin’ Donuts • Baskin Robbins • Pollo Campero • American Express Global Business Travel • Western Union • The Children's Hospital of Denver • PacifiCare Health Systems • Five Below • Marvin Windows & Doors • Kum & Go • Walmart • Target • EY • American Institute of CPAs • Tasti D - Lite • Planet Smoothie • Mail Boxes Etc. • The UPS Store • I Can’t Believe It’s Yogurt DC, Northwestern Health Sciences Univ. BS, Northwestern Health Sciences Univ. BA, Univ. of Rhode Island BA, Univ. of Phoenix, Certified PMP MAOM, Univ . of Phoenix BA, Univ . of Minnesota - Winona MA, Univ. of Arizona BS, Univ. of Arizona MA, Univ. of London BA, Univ. of Washington © 2023 The Joint Corp. All Rights Reserved.

Board of Directors Glenn J. Krevlin Abe Hong Peter D. Holt Suzanne M. Decker Ronald V. DaVella, CPA Matthew E. Rubel Director, 2019 Director, 2018 Director, 2016 Director, 2017 Director, 2014 Lead Director, 2017 • Founder, Managing Partner, & PM Glenhill Capital Advisors • Dir. Ember Technologies • Former Mgmt. or Dir. • Centric Brands • Design within Reach • Restoration Hardware • Cumberland Associates • The Goldman Sachs Group • EVP & CTO, Learning Care Group • Former Mgmt.: • Discount Tire Company • Red Rock Resorts • Starbucks Corp. • Technologent • Pres. & CEO, The Joint Corp. • Former Mgmt.: • Tasti D - Lite • Great Hills Partners • Mail Boxes, Etc. (now The UPS Store) • Director Intl.l Franchise Assn. (IFA) • Chair, International Affairs Network (IAN) • Former Exe. Project Sponsor and Chief HR Officer, Aspen Dental Mgmt • HR & Talent Acquisition Advisor, Bond Veterinary • Former Dir. Refresh Mental Health Davis Vision Companies • Financial Advisor: Manufacturing Succession Holding, and Universal Health • Vice Chair of the Strategic Advisory Board of Aura Ventures • Dir. Alkaline Water Co., Universal Health Group, Delta Dental of Arizona, and NorthStar Security • Former: Deloitte & Touche Mobile Home Parks NanoFlex Power Corp. and Amazing Lash Studio CFO & franchisee • Executive Chair KidKraft, Inc. • Chair, Holley Inc. & Mid Ocean Ptrs. PE Consumer Group • Former Dir. Hudson's Bay Co., HSNi & Treehouse Foods • Former: Roark Capital, TPG Capital, TPG Growth, Varsity Brands, Collective Brands, Cole Haan, J Crew, Popular Club Plan and more • Pres. Appointee, House Advisory Council on Trade Policy Negotiation BA, Wesleyan University MBA, New York University BE, U.S. Military Academy at West Point BA, Univ. of Washington MA, University of London BS, Russell Sage College BS, Queens College MBA, Pace University BS, Ohio University MBA, University of Miami
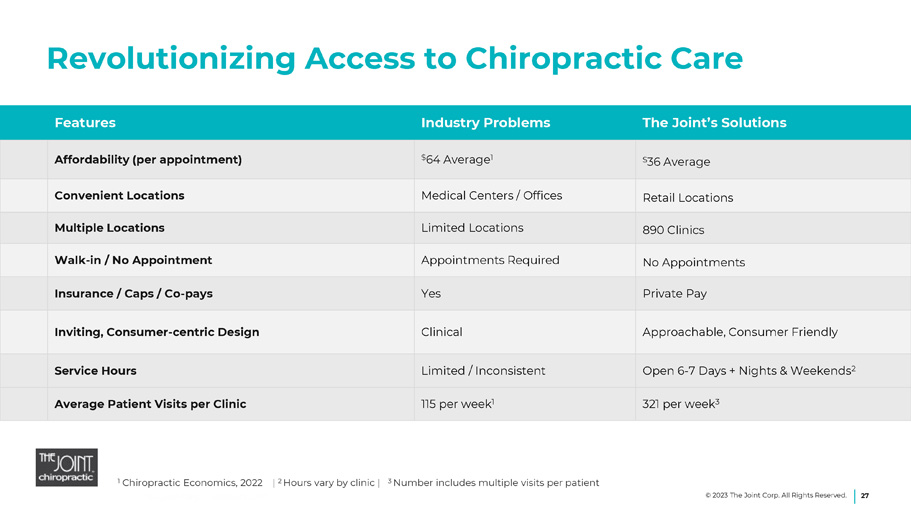
Revolutionizing Access to Chiropractic Care © 2023 The Joint Corp. All Rights Reserved. 27 1 Chiropractic Economics, 2022 | 2 Hours vary by clinic | 3 Number includes multiple visits per patient The Joint’s Solutions Industry Problems Features $ 36 Average $ 64 Average 1 Affordability (per appointment) Retail Locations Medical Centers / Offices Convenient Locations 890 Clinics Limited Locations Multiple Locations No Appointments Appointments Required Walk - in / No Appointment Private Pay Yes Insurance / Caps / Co - pays Approachable, Consumer Friendly Clinical Inviting, Consumer - centric Design Open 6 - 7 Days + Nights & Weekends 2 Limited / Inconsistent Service Hours 321 per week 3 115 per week 1 Average Patient Visits per Clinic
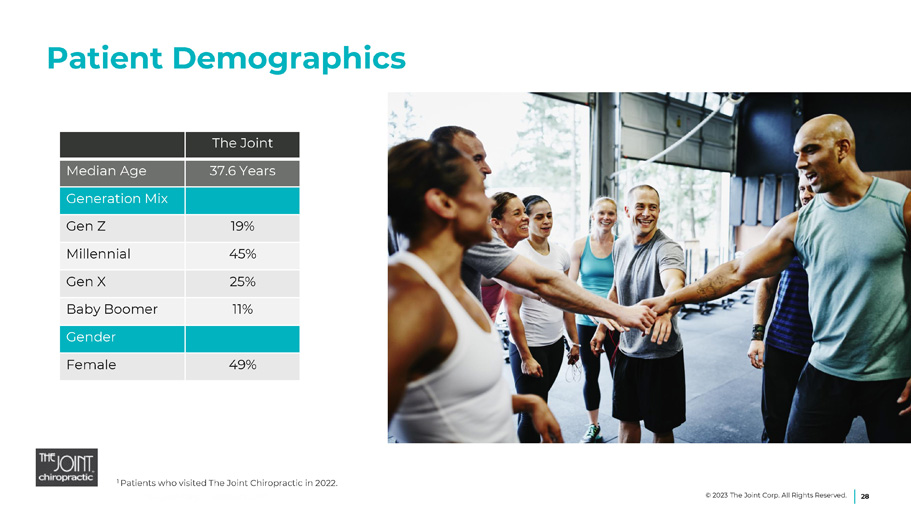
Patient Demographics 1 Patients who visited The Joint Chiropractic in 2022. The Joint 37.6 Years Median Age Generation Mix 19% Gen Z 45% Millennial 25% Gen X 11% Baby Boomer Gender 49% Female © 2023 The Joint Corp. All Rights Reserved. 28
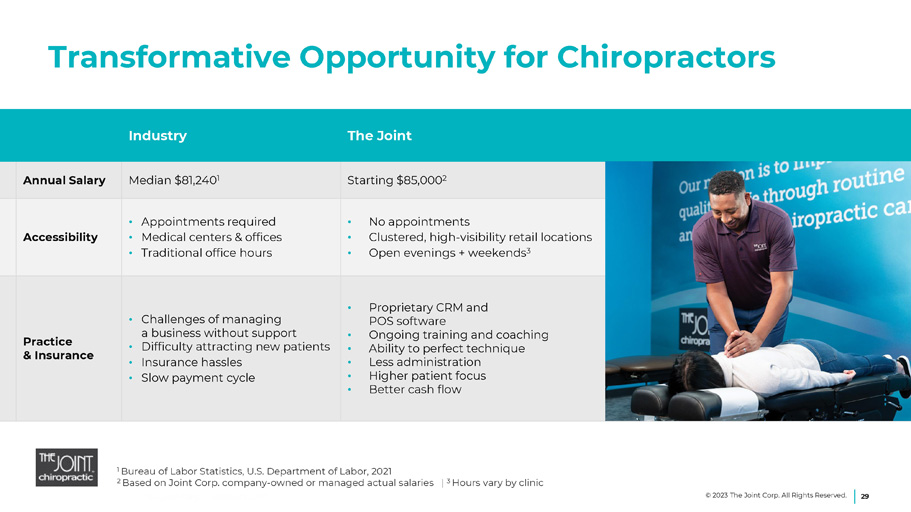
Transformative Opportunity for Chiropractors 1 Bureau of Labor Statistics, U.S. Department of Labor, 2021 2 Based on Joint Corp. company - owned or managed actual salaries | 3 Hours vary by clinic The Joint Industry Starting $85,000 2 Median $81,240 1 Annual Salary • No appointments • Clustered, high - visibility retail locations • Open evenings + weekends 3 • Appointments required • Medical centers & offices • Traditional office hours Accessibility • Proprietary CRM and POS software • Ongoing training and coaching • Ability to perfect technique • Less administration • Higher patient focus • Better cash flow • Challenges of managing a business without support • Difficulty attracting new patients • Insurance hassles • Slow payment cycle Practice & Insurance © 2023 The Joint Corp. All Rights Reserved. 29
Performance Metrics and Non - GAAP Measures © 2023 The Joint Corp. All Rights Reserved. 30 This presentation includes commonly discussed performance metrics. System - wide sales include sales at all clinics, whether operated by the company or by franchisees. While franchised sales are not recorded as revenues by the company, management believes the information is important in understanding the company’s financial performance, because these sales are the basis on which the company calculates and records royalty fees and are indicative of the financial health of the franchisee base. Comp sales include the sales from both company - owned or managed clinics and franchised clinics that in each case have been open at least 13 full months and exclude any clinics that have closed. This presentation includes non - GAAP financial measures. EBITDA and Adjusted EBITDA are presented because they are important measures used by management to assess financial performance, as management believes they provide a more transparent view of the Company’s underlying operating performance and operating trends than GAAP measures alone. Reconciliations of net loss to EBITDA and Adjusted EBITDA are presented where applicable. The Company defines EBITDA as net income/(loss) before net interest, tax expense, depreciation, and amortization expenses. The Company defines Adjusted EBITDA as EBITDA before acquisition - related expenses, bargain purchase net gain, gain/(loss) on disposition or impairment, stock - based compensation expenses and employee retention credits. EBITDA and Adjusted EBITDA do not represent and should not be considered alternatives to net income or cash flows from operations, as determined by accounting principles generally accepted in the United States, or GAAP. While EBITDA and Adjusted EBITDA are frequently used as measures of financial performance and the ability to meet debt service requirements, they are not necessarily comparable to other similarly titled captions of other companies due to potential inconsistencies in the methods of calculation. EBITDA and Adjusted EBITDA should be reviewed in conjunction with the Company’s financial statements filed with the SEC.
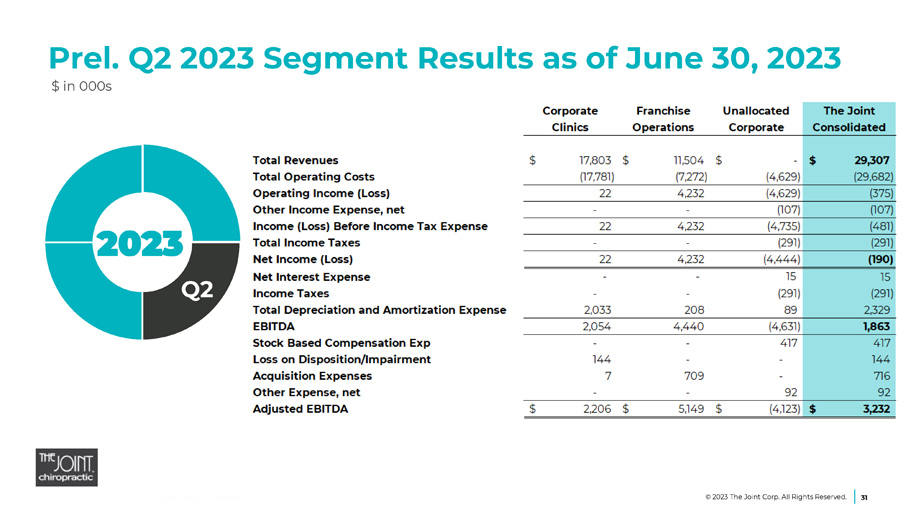
Prel. Q2 2023 Segment Results as of June 30, 2023 $ in 000s 2023 Q2 © 2023 The Joint Corp. All Rights Reserved. 31

Prel. YTD Segment Results as of June 30, 2023 $ in 000s 2023 H1 © 2023 The Joint Corp. All Rights Reserved. 32
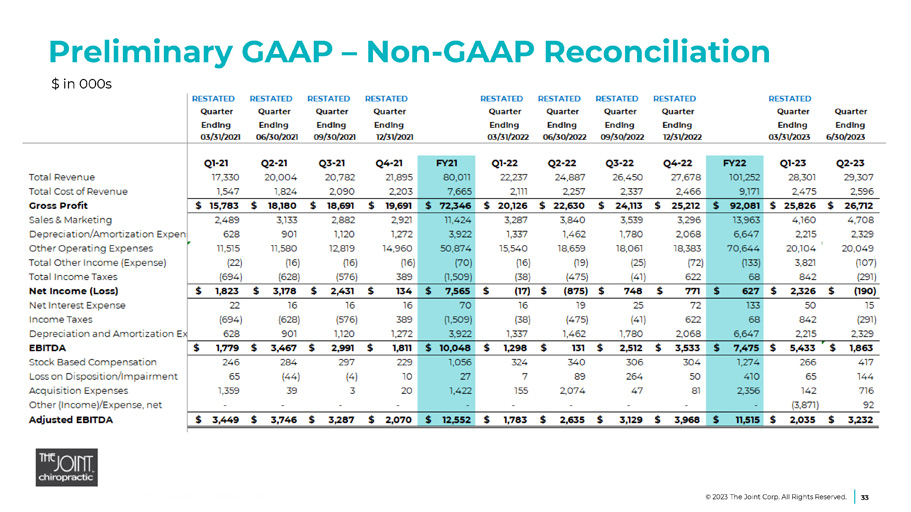
Preliminary GAAP – Non - GAAP Reconciliation $ in 000s © 2023 The Joint Corp. All Rights Reserved. 33

Jake Singleton, CFO [email protected] The Joint Corp. | 16767 N. Perimeter Dr., Suite 110, Scottsdale, AZ 85260 | (480) 245 - 5960 https://www.facebook.com/thejointchiro @thejointchiro © 2023 The Joint Corp. All Rights Reserved. 34 https://twitter.com/thejointchiro @thejointchiro https://www.youtube.com/thejointcorp @thejointcorp Peter D. Holt, President & CEO [email protected] The Joint Corp. | 16767 N. Perimeter Dr., Suite 110, Scottsdale, AZ 85260 | (480) 245 - 5960 Kirsten Chapman, LHA Investor Relations [email protected] LHA Investor Relations | 50 California Street, Suite 1500 | San Francisco, CA 94111| (415) 433 - 3777 Contact Information