
EXHIBIT 99.2
Q2 2023 Operating Highlights As of June 30, 2023 | Reported on August 10, 2023 The Joint Corp. | NASDAQ: JYNT | thejoint.com
2 © 2023 The Joint Corp. All Rights Reserved. Safe Harbor Statements Certain statements contained in this presentation are "forward - looking statements” about future events and expectations. Forward - looking statements are based on our beliefs, assumptions and expectations of industry trends, our future financial and operating performance and our growth plans, taking into account the information currently available to us. These statements are not statements of historical fact. Forward - looking statements involve risks and uncertainties that may cause our actual results to differ materially from the expectations of future results we express or imply in any forward - looking statements, and you should not place undue reliance on such statements. Factors that could contribute to these differences include, our inability to identify and recruit enough qualified chiropractors and other personnel to staff our clinics, due in part to the nationwide labor shortage, and an increase in operating expenses due to measures we may need to take to address such shortage, inflation, exacerbated by COVID - 19 and the current war in Ukraine, which has increased our costs and which could otherwise negatively impact our business, the potential for further disruption to our operations and the unpredictable impact on our business of the COVID - 19 outbreak and outbreaks of other contagious diseases, our failure to develop or acquire company - owned or managed clinics as rapidly as we intend, our failure to profitably operate company - owned or managed clinics, short - selling strategies and negative opinions posted on the internet which could drive down the market price of our common stock and result in class action lawsuits, our failure to remediate future material weaknesses in our internal control over financial reporting, which could negatively impact our ability to accurately report our financial results, prevent fraud, or maintain investor confidence, and other factors described in our filings with the SEC, including in the section entitled “Risk Factors” in our Annual Report on Form 10 - K for the year ended December 31, 2022 filed with the SEC on March 10, 2023 and subsequently - filed current and quarterly reports. Words such as, "anticipates," "believes," "continues," "estimates," "expects," "goal," "objectives," "intends," "may," "opportunity," "plans," "potential," "near - term," "long - term," "projections," "assumptions," "projects," "guidance," "forecasts," "outlook," "target," "trends," "should," "could," "would," "will," and similar expressions are intended to identify such forward - looking statements. We qualify any forward - looking statements entirely by these cautionary factors. We assume no obligation to update or revise any forward - looking statements for any reason or to update the reasons actual results could differ materially from those anticipated in these forward - looking statements, even if new information becomes available in the future. Comparisons of results for current and any prior periods are not intended to express any future trends or indications of future performance, unless expressed as such, and should only be viewed as historical data. Business Structure The Joint Corp. is a franchisor of clinics and an operator of clinics in certain states. In Arkansas, California, Colorado, District of Columbia, Florida, Illinois, Kansas, Kentucky, Maryland, Michigan, Minnesota, New Jersey, New York, North Carolina, Oregon, Pennsylvania, Rhode Island, South Dakota, Tennessee, Washington, West Virginia and Wyoming, The Joint Corp. and its franchisees provide management services to affiliated professional chiropractic practices.

© 2022 The Joint Corp. All Rights Reserved. 3
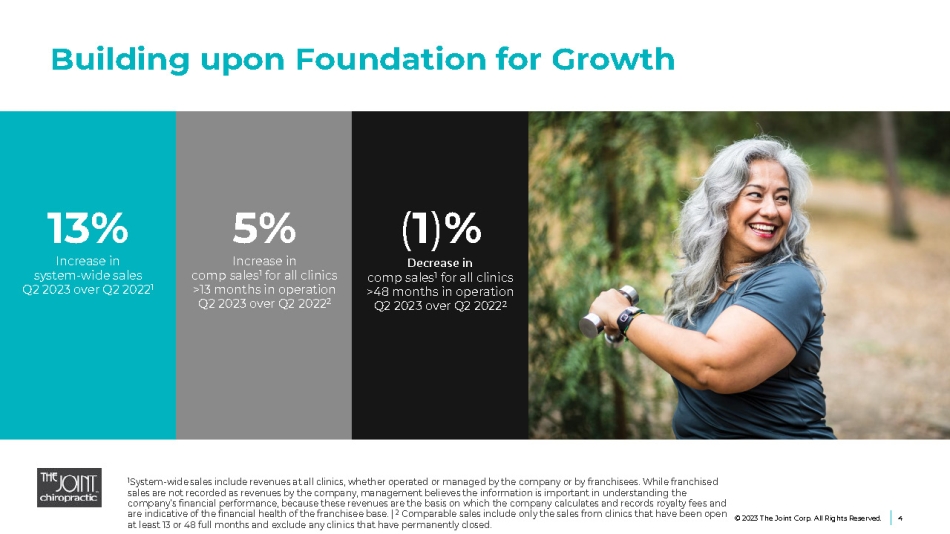
Building upon Foundation for Growth 4 © 2023 The Joint Corp. All Rights Reserved. 13% Increase in system - wide sales Q2 2023 over Q2 2022 1 5% Increase in comp sales 1 for all clinics >13 months in operation Q2 2023 over Q2 2022 2 ( 1 ) % Decrease in comp sales 1 for all clinics >48 months in operation Q2 2023 over Q2 2022 2 1 System - wide sales include revenues at all clinics, whether operated or managed by the company or by franchisees. While franchised sales are not recorded as revenues by the company, management believes the information is important in understanding the company’s financial performance, because these revenues are the basis on which the company calculates and records royalty fees and are indicative of the financial health of the franchisee base. | 2 Comparable sales include only the sales from clinics that have been open at least 13 or 48 full months and exclude any clinics that have permanently closed.
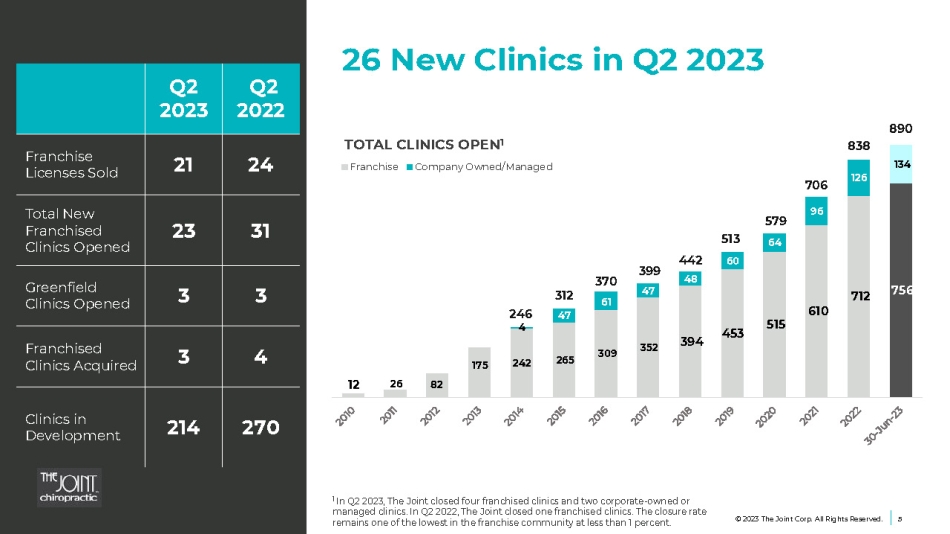
© 2023 The Joint Corp. All Rights Reserved. 5 26 New Clinics in Q2 2023 Q2 2022 Q2 2023 24 21 Franchise Licenses Sold 31 23 Total New Franchised Clinics Opened 3 3 Greenfield Clinics Opened 4 3 Franchised Clinics Acquired 270 214 Clinics in Development 12 26 82 175 242 265 309 352 394 453 515 610 712 756 4 47 61 47 48 60 64 96 126 134 TOTAL CLINICS OPEN 1 Franchise Company Owned/Managed 1 In Q2 2023, The Joint closed four franchised clinics and two corporate - owned or managed clinics. In Q2 2022, The Joint closed one franchised clinics. The closure rate remains one of the lowest in the franchise community at less than 1 percent. 370 399 442 513 312 246 579 706 838 890
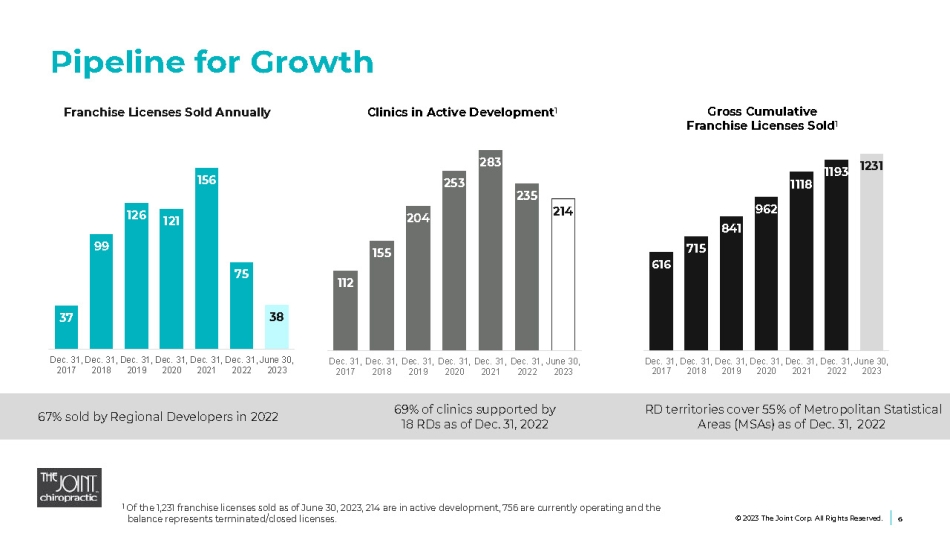
RD territories cover 55% of Metropolitan Statistical Areas (MSAs) as of Dec. 31, 2022 69% of clinics supported by 18 RDs as of Dec. 31, 2022 67% sold by Regional Developers in 2022 37 99 126 121 156 75 38 Dec. 31, Dec. 31, Dec. 31, Dec. 31, Dec. 31, Dec. 31, June 30, 2017 2018 2019 2020 2021 2022 2023 616 715 841 962 1118 1193 1231 Dec. 31, Dec. 31, Dec. 31, Dec. 31, Dec. 31, Dec. 31, June 30, 2017 2018 2019 2020 2021 2022 2023 112 155 204 253 283 235 214 Dec. 31, Dec. 31, Dec. 31, Dec. 31, Dec. 31, Dec. 31, June 30, 2017 2018 2019 2020 2021 2022 2023 Pipeline for Growth 6 1 Of the 1,231 franchise licenses sold as of June 30, 2023, 214 are in active development, 756 are currently operating and the balance represents terminated/closed licenses. Gross Cumulative Franchise Licenses Sold 1 Franchise Licenses Sold Annually Clinics in Active Development 1 © 2023 The Joint Corp. All Rights Reserved.
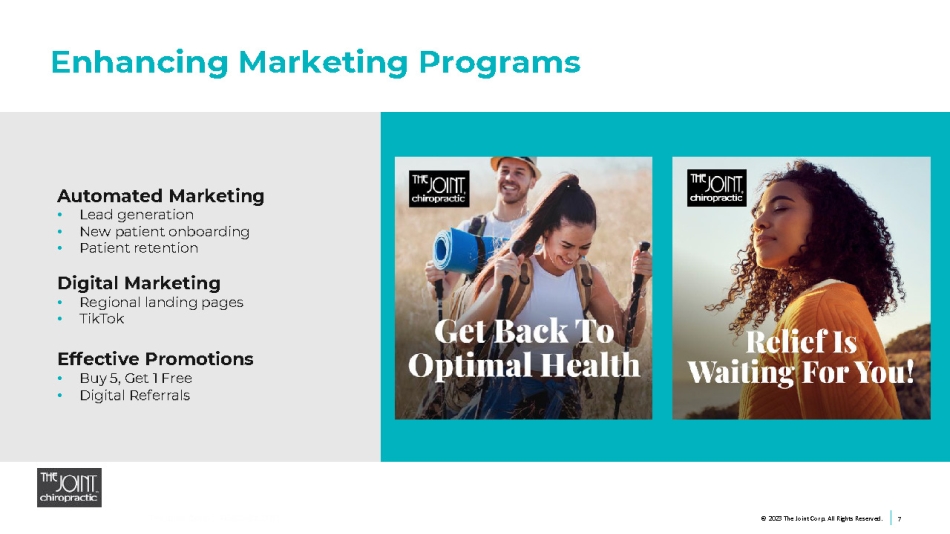
Enhancing Marketing Programs 7 © 2023 The Joint Corp. All Rights Reserved. Automated Marketing • Lead generation • New patient onboarding • Patient retention Digital Marketing • Regional landing pages • TikTok Effective Promotions • Buy 5, Get 1 Free • Digital Referrals

Leading Market Growth The Joint Corp. 12 - yr. CAGR 62% 1 vs. Industry 5 - yr. CAGR 5.1% 2 People will continue to seek more noninvasive, holistic ways to manage their pain. We’ll be there to treat them. 1 For the period ended Dec. 31, 2022 2 March 2023 Kentley Insights Chiropractic Care Market Research Report 8 © 2023 The Joint Corp. All Rights Reserved. System - wide Sales ($ in M) 62% CAGR 1 (2010 - 2022) $8.1 $22.3 $98.6 $70.1 $46.2 $126.9 $165.1 $220.3 $260.0 $361.1 $435.3 $235.5
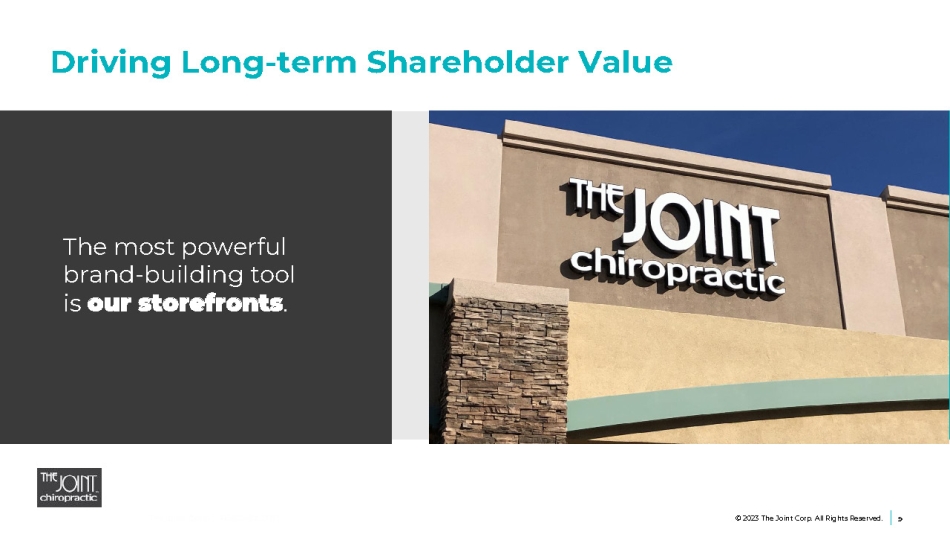
Driving Long - term Shareholder Value 9 © 2023 The Joint Corp. All Rights Reserved. The most powerful brand - building tool is our storefronts .
Jake Singleton, CFO [email protected] The Joint Corp. | 16767 N. Perimeter Dr., Suite 110, Scottsdale, AZ 85260 | (480) 245 - 5960 https://www.facebook.com/thejointchiro @thejointchiro https://twitter.com/thejointchiro @thejointchiro https://www.youtube.com/thejointcorp @thejointcorp Peter D. Holt, President & CEO [email protected] The Joint Corp. | 16767 N. Perimeter Dr., Suite 110, Scottsdale, AZ 85260 | (480) 245 - 5960 Kirsten Chapman, LHA Investor Relations [email protected] LHA Investor Relations | 50 California Street, Suite 1500 | San Francisco, CA 94111| (415) 433 - 3777 Contact Information 10 © 2023 The Joint Corp. All Rights Reserved.