Exhibit 99.2
Q2 2022 Financial Results As of June 30 , 2022 | Reported on August 4, 2022
Safe Harbor Statements Certain statements contained in this presentation are "forward - looking statements” about future events and expectations. Forward - looking statements are based on our beliefs, assumptions and expectations of industry trends, our future financial and operating performance and our growth plans, taking int o account the information currently available to us. These statements are not statements of historical fact. Forward - looking statements involve risks and uncertainties that may caus e our actual results to differ materially from the expectations of future results we express or imply in any forward - looking statements, and you should not place undue reliance on such statements. Factors that could contribute to these differences include, but are not limited to, the continuing impact of the COVID - 19 outbreak on the economy and our operati ons (including temporary clinic closures, shortened business hours and reduced patient demand), inflation, exacerbated by COVID - 19 and the current war in Ukraine, our failure to de velop or acquire company - owned or managed clinics as rapidly as we intend, our failure to profitably operate company - owned or managed clinics, our inability to identify a nd recruit enough qualified chiropractors and other personnel to staff our clinics, due in part to the nationwide labor shortage, short - selling strategies and negative opinions pos ted on the internet which could drive down the market price of our common stock and result in class action lawsuits, our failure to remediate the current or future material weakne sse s in our internal control over financial reporting, which could negatively impact our ability to accurately report our financial results, prevent fraud, or maintain investor confidenc e, and other factors described in our filings with the SEC, including in the section entitled “Risk Factors” in our Annual Report on Form 10 - K for the year ended December 31, 2021 filed wi th the SEC on March 14, 2022 and subsequently - filed current and quarterly reports.. Words such as, "anticipates," "believes," "continues," "estimates," "expects," "goal," "objec tiv es," "intends," "may," "opportunity," "plans," "potential," "near - term," "long - term," "projections," "assumptions," "projects," "guidance," "forecasts," "outlook," "target," "trends," "sho uld," "could," "would," "will," and similar expressions are intended to identify such forward - looking statements. We qualify any forward - looking statements entirely by these cautionary fac tors. We assume no obligation to update or revise any forward - looking statements for any reason or to update the reasons actual results could differ materially from those anticipated in these forward - looking statements, even if new information becomes available in the future. Comparisons of results for current and any prior periods are not intended to exp res s any future trends or indications of future performance, unless expressed as such, and should only be viewed as historical data. Business Structure The Joint Corp. is a franchisor of clinics and an operator of clinics in certain states. In Arkansas, California, Colorado, D ist rict of Columbia, Florida, Illinois, Kansas, Kentucky, Maryland, Massachusetts, Michigan, Minnesota, New Jersey, New York, North Carolina, Oregon, Pennsylvania, Rhode Island, South Da kota, Tennessee, Washington, West Virginia and Wyoming, The Joint Corp. and its franchisees provide management services to affiliated professional chiropractic practice s. 2
The Joint © 2022 The Joint Corp. All Rights Reserved. 3 Forging the Chiropractic Dream Accelerating the Pace of Clinic Growth Harnessing the Power of Our Data
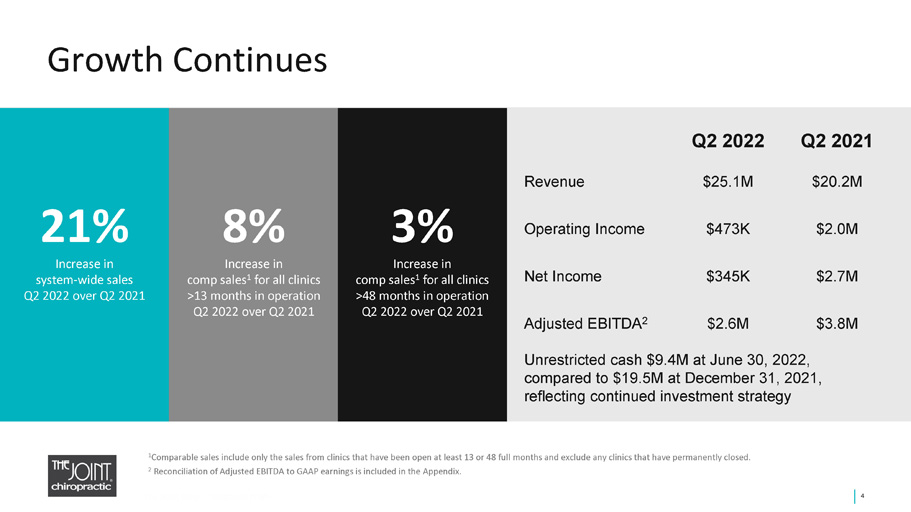
Growth Continues 4 Q2 2022 Q2 2021 Revenue $25.1M $20.2M Operating Income $473K $2.0M Net Income $345K $2.7M Adjusted EBITDA 2 $2.6M $3.8M Unrestricted cash $9.4M at June 30, 2022, compared to $19.5 M at December 31, 2021, reflecting continued investment strategy © 2022 The Joint Corp. All Rights Reserved. 1 Comparable sales include only the sales from clinics that have been open at least 13 or 48 full months and exclude any clinics that have permanently closed. 2 Reconciliation of Adjusted EBITDA to GAAP earnings is included in the Appendix. 21% Increase in system - wide sales Q2 2022 over Q2 2021 8% In crease in comp sales 1 for all clinics >13 months in operation Q2 2022 over Q2 2021 3% In crease in comp sales 1 for all clinics >48 months in operation Q2 2022 over Q2 2021 4
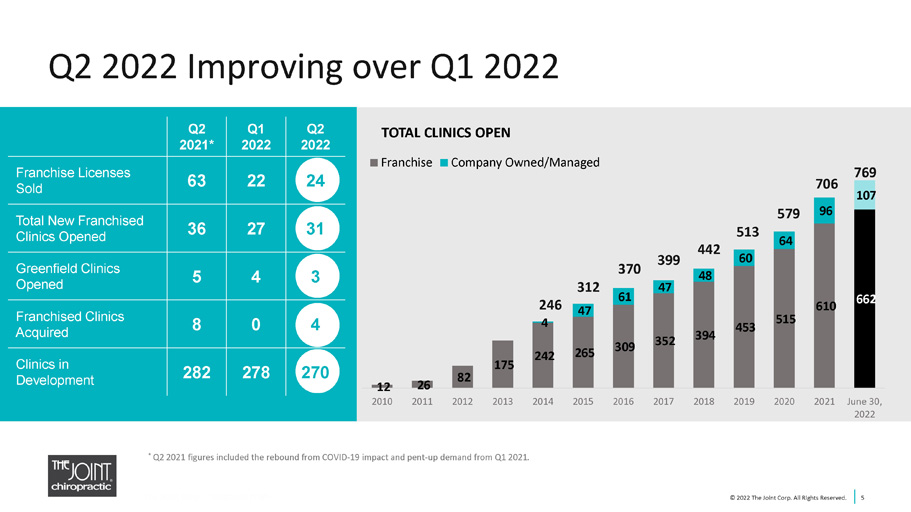
12 26 82 175 242 265 309 352 394 453 515 610 662 4 47 61 47 48 60 64 96 107 2010 2011 2012 2013 2014 2015 2016 2017 2018 2019 2020 2021 June 30, 2022 TOTAL CLINICS OPEN Franchise Company Owned/Managed Q2 2022 Improving over Q1 2022 © 2022 The Joint Corp. All Rights Reserved. 5 Q2 2021* Q1 2022 Q2 2022 Franchise Licenses Sold 63 22 24 Total New Franchised Clinics Opened 36 27 31 Greenfield Clinics Opened 5 4 3 Franchised Clinics Acquired 8 0 4 Clinics in Development 282 278 270 370 399 442 513 312 246 579 706 769 * Q2 2021 figures included the rebound from COVID - 19 impact and pent - up demand from Q1 2021.
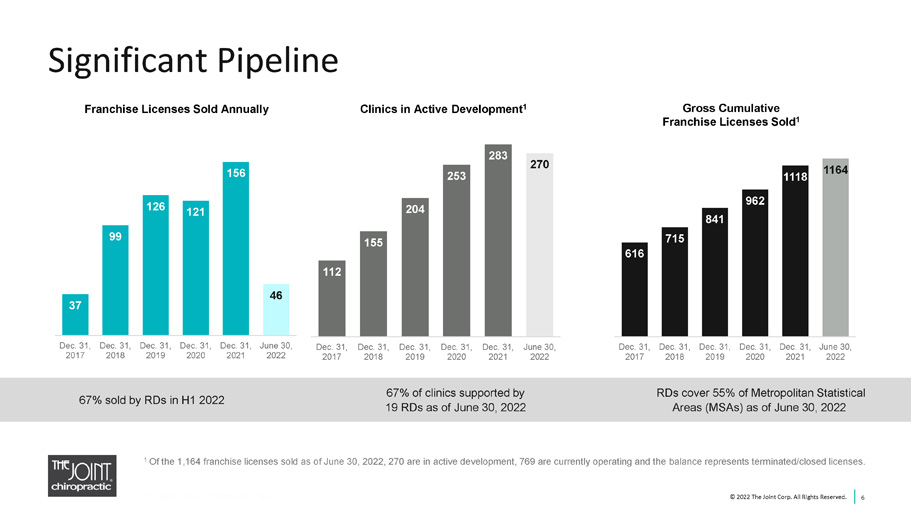
67% sold by RDs in H1 2022 67% of clinics supported by 19 RDs as of June 30, 2022 RDs cover 55% of Metropolitan Statistical Areas (MSAs) as of June 30, 2022 37 99 126 121 156 46 Dec. 31, 2017 Dec. 31, 2018 Dec. 31, 2019 Dec. 31, 2020 Dec. 31, 2021 June 30, 2022 616 715 841 962 1118 1164 Dec. 31, 2017 Dec. 31, 2018 Dec. 31, 2019 Dec. 31, 2020 Dec. 31, 2021 June 30, 2022 112 155 204 253 283 270 Dec. 31, 2017 Dec. 31, 2018 Dec. 31, 2019 Dec. 31, 2020 Dec. 31, 2021 June 30, 2022 Significant Pipeline © 2022 The Joint Corp. All Rights Reserved. 6 1 Of the 1,164 franchise licenses sold as of June 30, 2022, 270 are in active development, 769 are currently operating and the bal ance represents terminated/closed licenses. Gross Cumulative Franchise Licenses Sold 1 Franchise Licenses Sold Annually Clinics in Active Development 1 © 2022 The Joint Corp. All Rights Reserved.
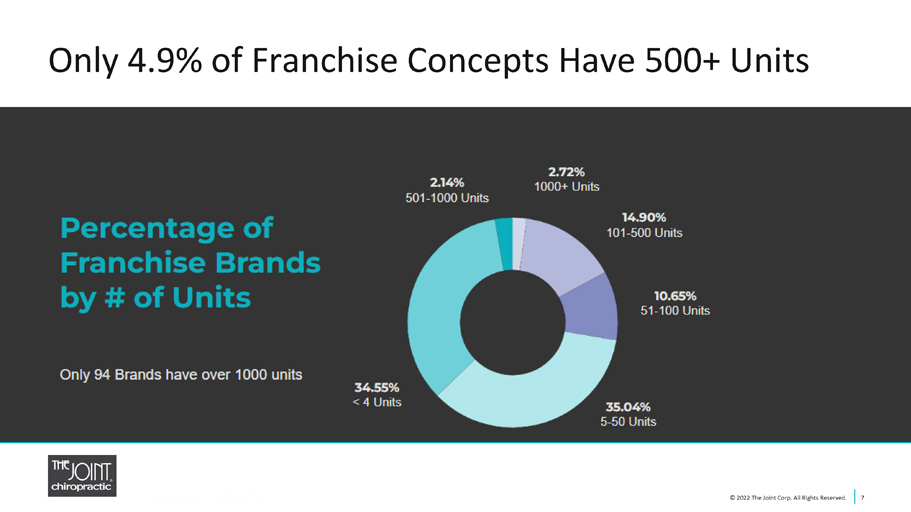
Only 4.9% of Franchise Concepts Have 500+ Units © 2022 The Joint Corp. All Rights Reserved. 7
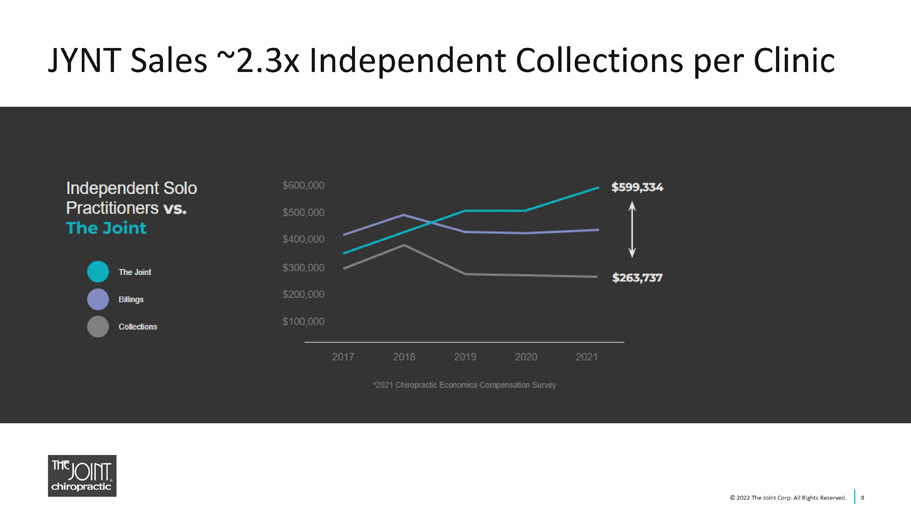
JYNT Sales ~2.3x Independent Collections per Clinic © 2022 The Joint Corp. All Rights Reserved. 8
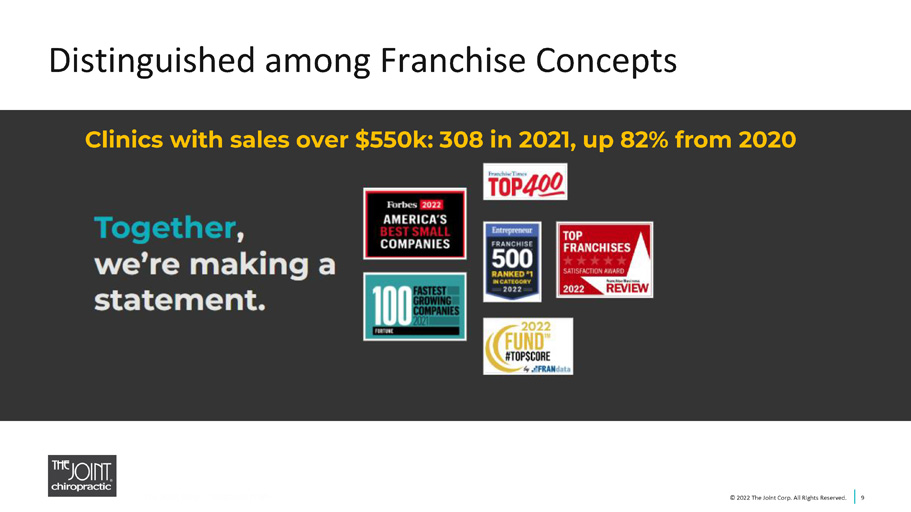
Distinguished among Franchise Concepts © 2022 The Joint Corp. All Rights Reserved. 9 Clinics with sales over $550k: 308 in 2021, up 82% from 2020
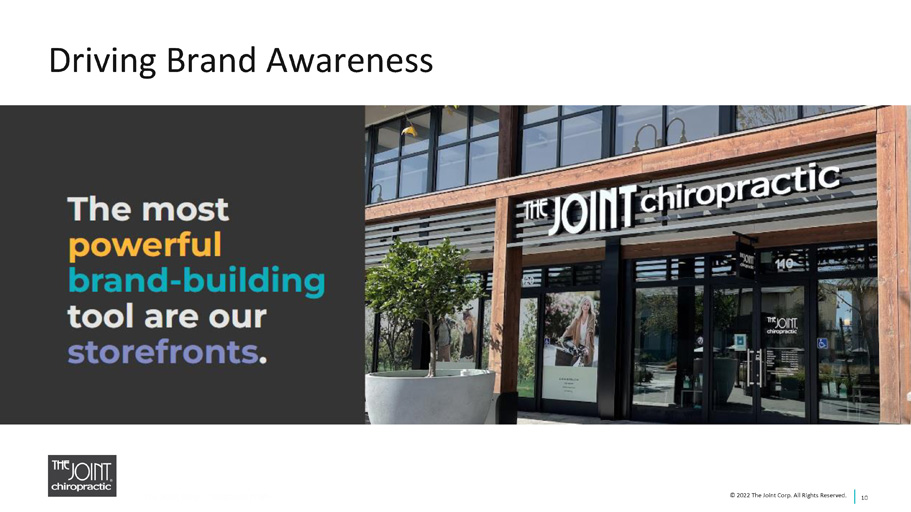
Driving Brand Awareness 10 © 2022 The Joint Corp. All Rights Reserved.
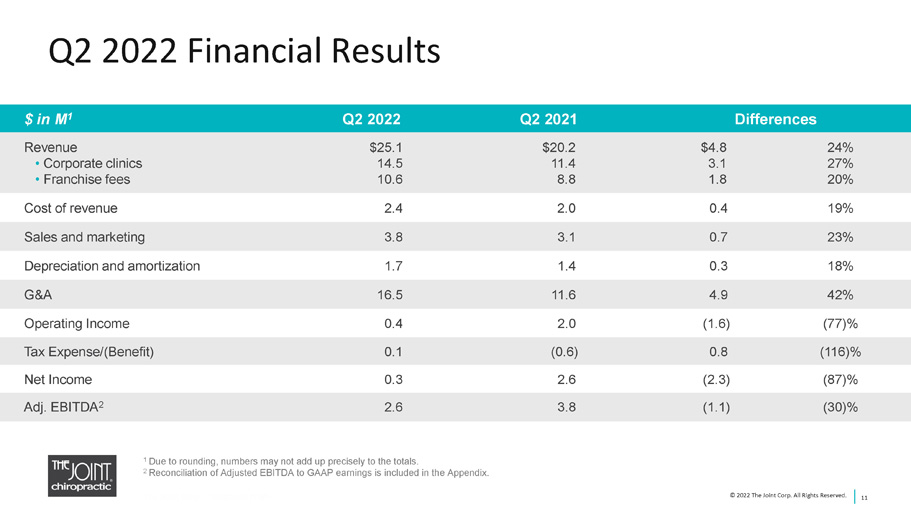
Q2 2022 Financial Results 11 $ in M 1 Q2 2022 Q2 2021 Differences Revenue • Corporate clinics • Franchise fees $25.1 14.5 10.6 $20.2 11.4 8.8 $4.8 3.1 1.8 24% 27% 20% Cost of revenue 2.4 2.0 0.4 19% Sales and marketing 3.8 3.1 0.7 23% Depreciation and amortization 1.7 1.4 0.3 18% G&A 16.5 11.6 4.9 42% Operating Income 0.4 2.0 (1.6) (77)% Tax Expense/(Benefit) 0.1 (0.6) 0.8 (116)% Net Income 0.3 2.6 (2.3) (87)% Adj. EBITDA 2 2.6 3.8 (1.1) (30)% © 2022 The Joint Corp. All Rights Reserved. 1 Due to rounding, numbers may not add up precisely to the totals. 2 Reconciliation of Adjusted EBITDA to GAAP earnings is included in the Appendix.
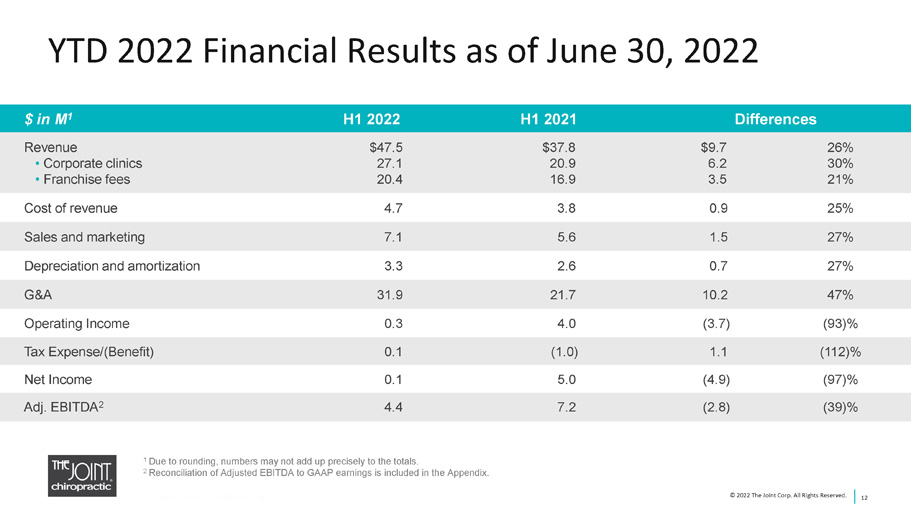
YTD 2022 Financial Results as of June 30, 2022 12 $ in M 1 H1 2022 H1 2021 Differences Revenue • Corporate clinics • Franchise fees $47.5 27.1 20.4 $37.8 20.9 16.9 $9.7 6.2 3.5 26% 30% 21% Cost of revenue 4.7 3.8 0.9 25% Sales and marketing 7.1 5.6 1.5 27% Depreciation and amortization 3.3 2.6 0.7 27% G&A 31.9 21.7 10.2 47% Operating Income 0.3 4.0 (3.7) (93)% Tax Expense/(Benefit) 0.1 (1.0) 1.1 (112)% Net Income 0.1 5.0 (4.9) (97)% Adj. EBITDA 2 4.4 7.2 (2.8) (39)% © 2022 The Joint Corp. All Rights Reserved. 1 Due to rounding, numbers may not add up precisely to the totals. 2 Reconciliation of Adjusted EBITDA to GAAP earnings is included in the Appendix.
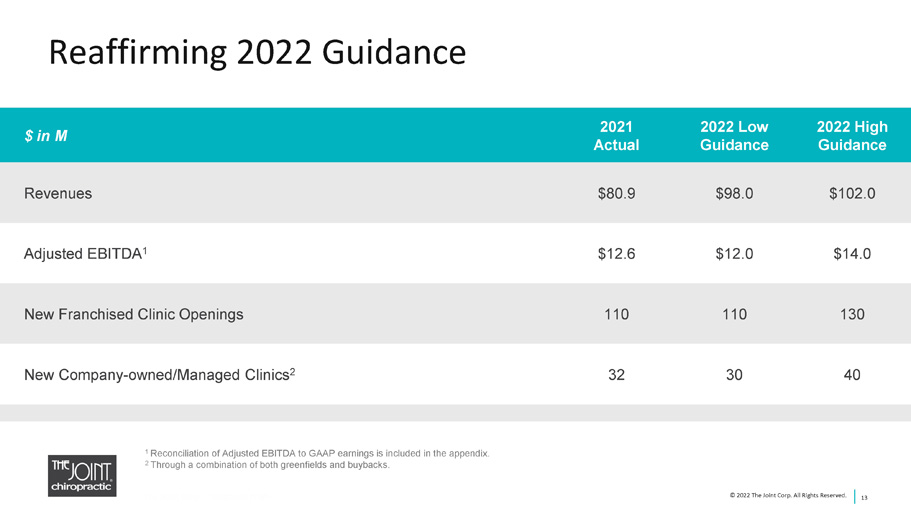
Reaffirming 2022 Guidance 13 $ in M 2021 Actual 2022 Low Guidance 2022 High Guidance Revenues $80.9 $98.0 $102.0 Adjusted EBITDA 1 $12.6 $12.0 $14.0 New Franchised Clinic Openings 110 110 130 New Company - owned/Managed Clinics 2 32 30 40 © 2022 The Joint Corp. All Rights Reserved. 1 Reconciliation of Adjusted EBITDA to GAAP earnings is included in the appendix. 2 Through a combination of both greenfields and buybacks.

Three Enterprise Initiatives to Advance Growth 14 © 2022 The Joint Corp. All Rights Reserved. Forging the Chiropractic Dream Accelerating the Pace of Clinic Growth Harnessing the Power of Our Data
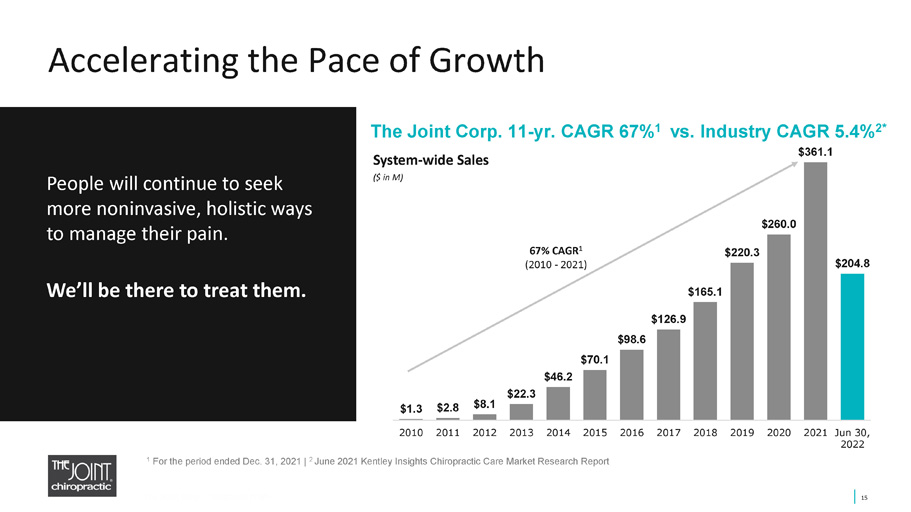
Accelerating the Pace of Growth People will continue to seek more noninvasive, holistic ways to manage their pain. We’ll be there to treat them. System - wide Sales ($ in M) 67% CAGR 1 (2010 - 2021) The Joint Corp. 11 - yr. CAGR 67% 1 vs. Industry CAGR 5.4% 2* 1 For the period ended Dec. 31, 2021 | 2 June 2021 Kentley Insights Chiropractic Care Market Research Report 15 $1.3 $2.8 $8.1 $22.3 $46.2 $70.1 $98.6 $126.9 $165.1 $220.3 $260.0 $361.1 $204.8 2010 2011 2012 2013 2014 2015 2016 2017 2018 2019 2020 2021 Jun 30, 2022
Performance Metrics and Non - GAAP Measures 16 This presentation includes commonly discussed performance metrics. System - wide sales include sales at all clinics, whether operated by the company or by franchisees. While franchised sales are not recorded as revenues by the company, management believes the information is impor tan t in understanding the company’s financial performance, because these sales are the basis on which the company calculates and records royalty fees a nd are indicative of the financial health of the franchisee base. Comp sales include the sales from both company - owned or managed clinics and franchised clinics that in each case have been open at least 13 full months and exclude any clinics that have closed. This presentation includes non - GAAP financial measures. EBITDA and Adjusted EBITDA are presented because they are important measures used by management to assess financial performance, as management believes they provide a more transparent view of the Company’s underlying operating performance and operating trends than GAAP measures alone. Reconciliations of net loss to EBITDA and Adjusted EBITDA are pres ent ed where applicable. The Company defines EBITDA as net income/(loss) before net interest, tax expense, depreciation, and amortization expenses. Th e C ompany defines Adjusted EBITDA as EBITDA before acquisition - related expenses, bargain purchase net gain, gain/(loss) on disposition or impairment, and stock - based compensation expenses. EBITDA and Adjusted EBITDA do not represent and should not be considered alternatives to net income or cash flows from operat ion s, as determined by accounting principles generally accepted in the United States, or GAAP. While EBITDA and Adjusted EBITDA are frequently used as measures of financial performance and the ability to meet debt service requirements, they are not necessarily comparable to other similarly titled cap tions of other companies due to potential inconsistencies in the methods of calculation. EBITDA and Adjusted EBITDA should be reviewed in conjunction with th e Company’s financial statements filed with the SEC. © 2022 The Joint Corp. All Rights Reserved.
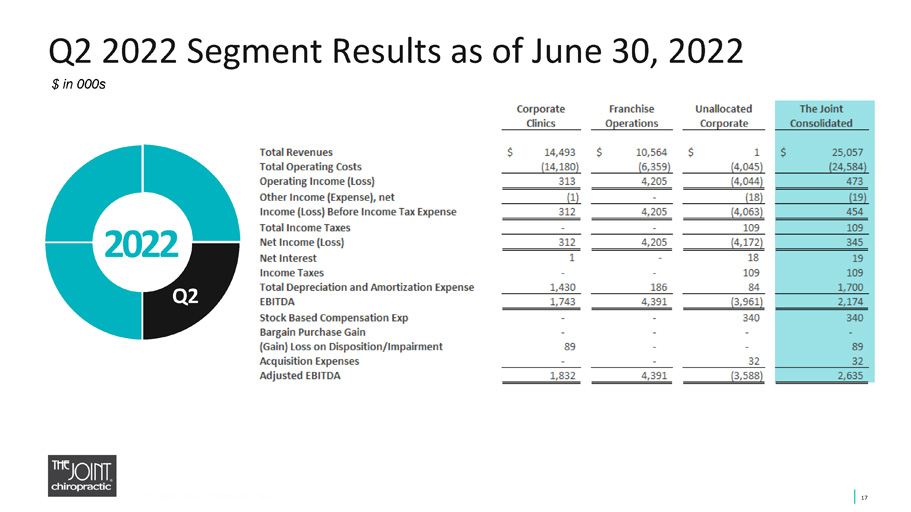
Q2 2022 Segment Results as of June 30, 2022 17 2022 Q2 © 2022 The Joint Corp. All Rights Reserved. $ in 000s
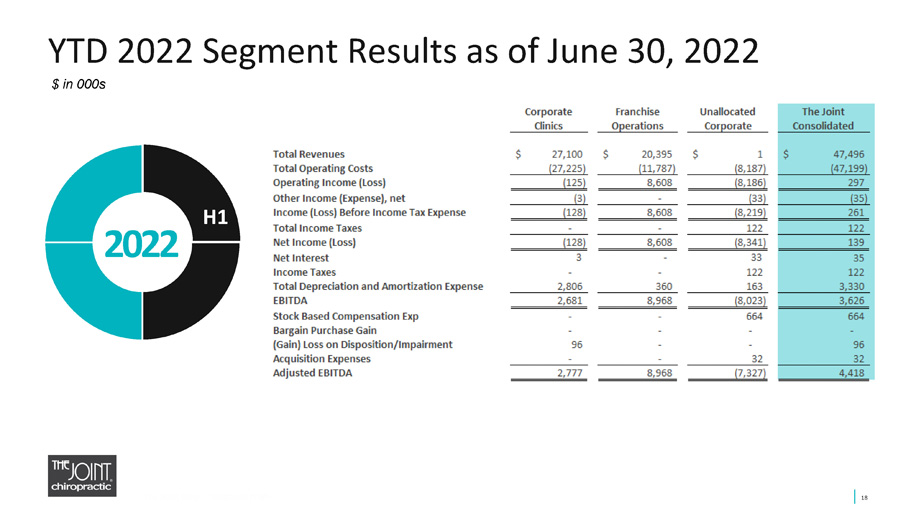
YTD 2022 Segment Results as of June 30, 2022 18 2022 H 1 © 2022 The Joint Corp. All Rights Reserved. $ in 000s
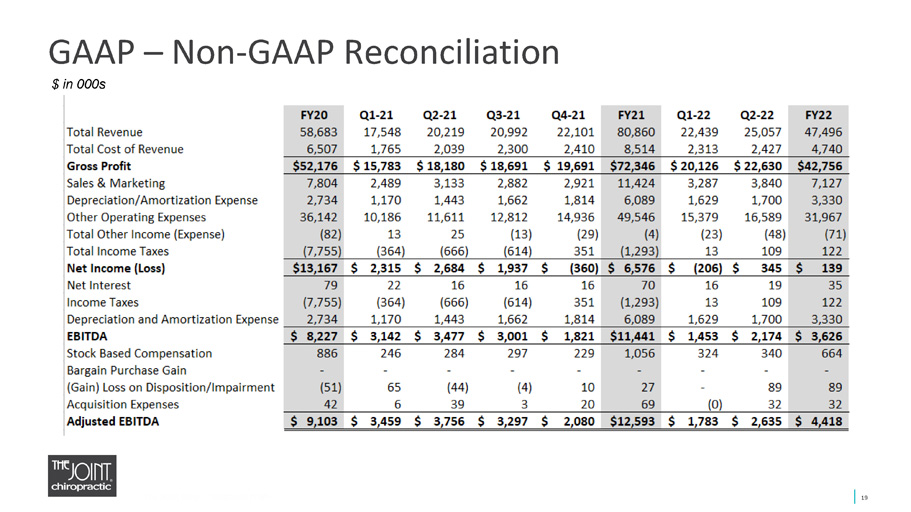
GAAP – Non - GAAP Reconciliation 19 © 2022 The Joint Corp. All Rights Reserved. $ in 000s
Jake Singleton, CFO jake.singleton@thejoint.com The Joint Corp. | 16767 N. Perimeter Dr., Suite 110, Scottsdale, AZ 85260 | (480) 245 - 5960 https://www.facebook.com/thejointchiro @ thejointchiro https://twitter.com/thejointchiro @ thejointchiro https://www.youtube.com/thejointcorp @ thejointcorp Peter D. Holt, President and CEO peter.holt@thejoint.com The Joint Corp. | 16767 N. Perimeter Dr., Suite 110, Scottsdale, AZ 85260 | (480) 245 - 5960 Kirsten Chapman, LHA Investor Relations thejoint@lhai.com LHA Investor Relations | 50 California Street, Suite 1500 | San Francisco, CA 94111| (415) 433 - 3777 © 2022 The Joint Corp. All Rights Reserved. 20 The Joint Corp. Contact Information 20