
EXHIBIT 99.2
© 2022 The Joint Corp. All Rights Reserved. 1 Q4 2021 Preliminary Financial Results As of December 31, 2021 | Reported on February 24, 2022
Safe Harbor Statement © 2022 The Joint Corp. All Rights Reserved. 2 Certain statements contained in this presentation are "forward - looking statements” about future events and expectations. Forward - looking statements are based on our beliefs, assumptions and expectations of industry trends, our future financial and operating performance and our growth plans, taking into account the in formation currently available to us. These statements are not statements of historical fact. Forward - looking statements involve risks and uncertainties that may cause our actual results to differ material ly from the expectations of future results we express or imply in any forward - looking statements, and you should not place undue reliance on such statements. Factors that could contribute to these differ enc es include, but are not limited to, the continuing impact of the COVID - 19 outbreak on the economy and our operations (including temporary clinic closures, shortened business hours and reduced patient de mand), our failure to develop or acquire company - owned or managed clinics as rapidly as we intend, our failure to profitably operate company - owned or managed clinics, our inability to identify a nd recruit enough qualified chiropractors and other personnel to staff our clinics, due in part to the nationwide labor shortage, short - selling strategies and negative opinions posted on the internet which could drive down the market price of our common stock and result in class action lawsuits, our failure to remediate the current or future material weaknesses in our internal control over financial reporting , w hich could negatively impact our ability to accurately report our financial results, prevent fraud, or maintain investor confidence, and other factors described in our filings with the SEC, including in the sec tio n entitled “Risk Factors” in our Annual Report on Form 10 - K for the year ended December 31, 2021 to be filed with the SEC and subsequently - filed current and quarterly reports.. Words such as, "anticipates," "believes," "continues," "estimates," "expects," "goal," "objectives," "intends," "may," "opportunity," "plans," "potential," "near - term," "long - term," "projections," "assumptions," "projects," "guid ance," "forecasts," "outlook," "target," "trends," "should," "could," "would," "will," and similar expressions are intended to identify such forward - looking statements. We qualify any forward - looking stateme nts entirely by these cautionary factors. We assume no obligation to update or revise any forward - looking statements for any reason or to update the reasons actual results could differ materially from tho se anticipated in these forward - looking statements, even if new information becomes available in the future. Comparisons of results for current and any prior periods are not intended to express any fut ure trends or indications of future performance, unless expressed as such, and should only be viewed as historical data. Business Structure The Joint Corp. is a franchisor of clinics and an operator of clinics in certain states. In Arkansas, California, Colorado, D ist rict of Columbia, Florida, Illinois, Kansas, Kentucky, Maryland, Massachusetts, Michigan, Minnesota, New Jersey, New York, North Carolina, Oregon, Pennsylvania, Rhode Island, South Dakota, Tennessee, Washi ngt on, West Virginia and Wyoming, The Joint Corp. and its franchisees provide management services to affiliated professional chiropractic practices.

Advancing Growth Strategy © 2022 The Joint Corp. All Rights Reserved. 3 Forging the Chiropractic Dream Accelerating the Pace of Clinic Growth Harnessing the Power of Our Data
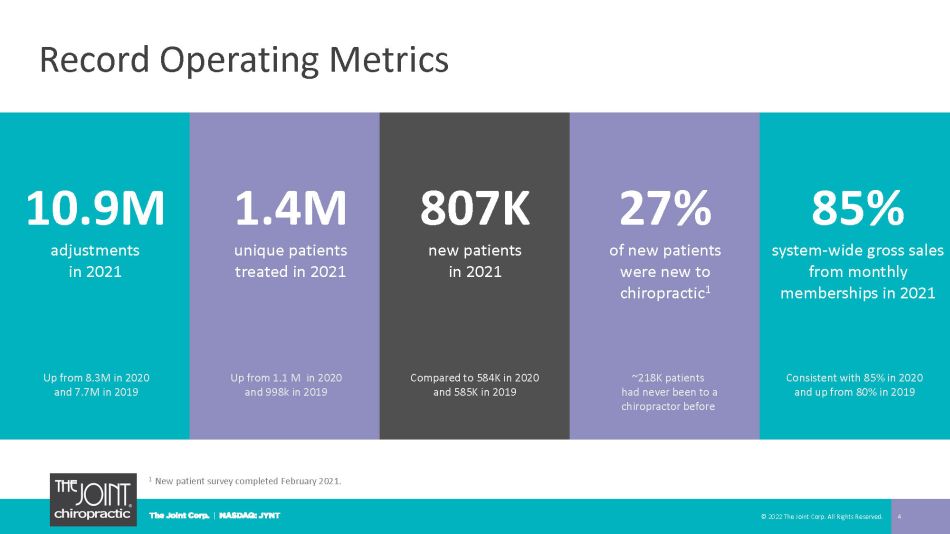
Record Operating Metrics © 2022 The Joint Corp. All Rights Reserved. 4 1 New patient survey completed February 2021. 1.4M unique patients treated in 2021 807K new patients in 2021 10.9M adjustments in 2021 27% of new patients were new to chiropractic 1 85% system - wide gross sales from monthly memberships in 2021 Up from 1.1 M in 2020 and 998k in 2019 ~218K patients had never been to a chiropractor before Compared to 584K in 2020 and 585K in 2019 Up from 8.3M in 2020 and 7.7M in 2019 Consistent with 85% in 2020 and up from 80% in 2019
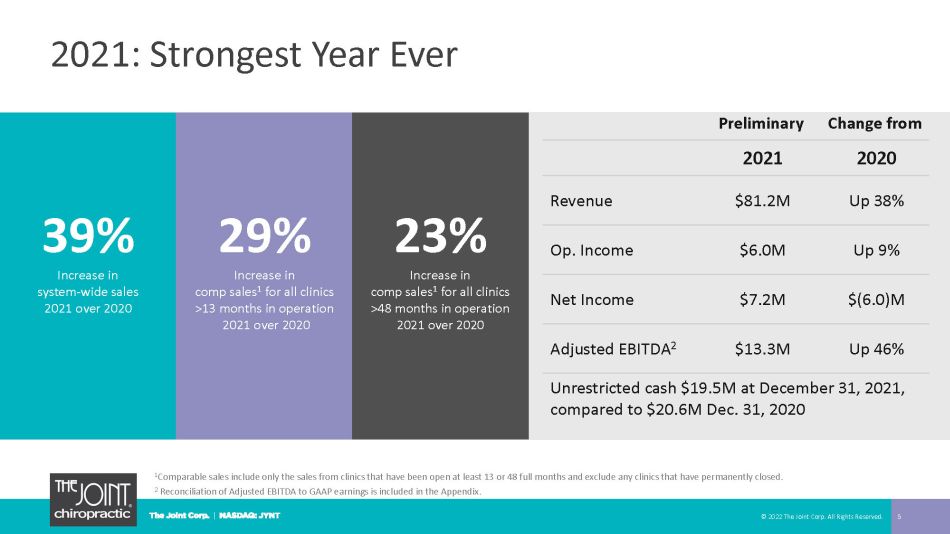
2021: Strongest Year Ever 5 Preliminary Change from 2021 2020 Revenue $81.2M Up 38% Op. Income $6.0M Up 9% Net Income $7.2M $(6.0)M Adjusted EBITDA 2 $13.3M Up 46% Unrestricted cash $19.5 M at December 31, 2021, compared to $20.6M Dec. 31, 2020 © 2022 The Joint Corp. All Rights Reserved. 1 Comparable sales include only the sales from clinics that have been open at least 13 or 48 full months and exclude any clinics that have permanently closed. 2 Reconciliation of Adjusted EBITDA to GAAP earnings is included in the Appendix. 39 % Increase in sy stem - wide sales 2021 over 2020 29% In crease in comp sales 1 for all clinics >13 months in operation 2021 over 2020 23 % In crease in comp sales 1 for all clinics >48 months in operation 2021 over 2020

12 26 82 175 242 265 309 352 394 453 515 610 4 47 61 47 48 60 64 96 2010 2011 2012 2013 2014 2015 2016 2017 2018 2019 2020 2021 TOTAL CLINICS OPEN Franchise Company Owned/Managed 156 Franchise Licenses Sold in 2021 - Up 29% YoY 130 Clinics Opened in 2021 - Up 78% YoY © 2022 The Joint Corp. All Rights Reserved. 6 2020 2021 Franchise Licenses Sold 121 156 Total New Franchised Clinics Opened 70 110 Greenfield Clinics Opened 3 20 Franchised Clinics Acquired 1 12 Clinics in Development 253 283 370 399 442 513 312 246 579 706
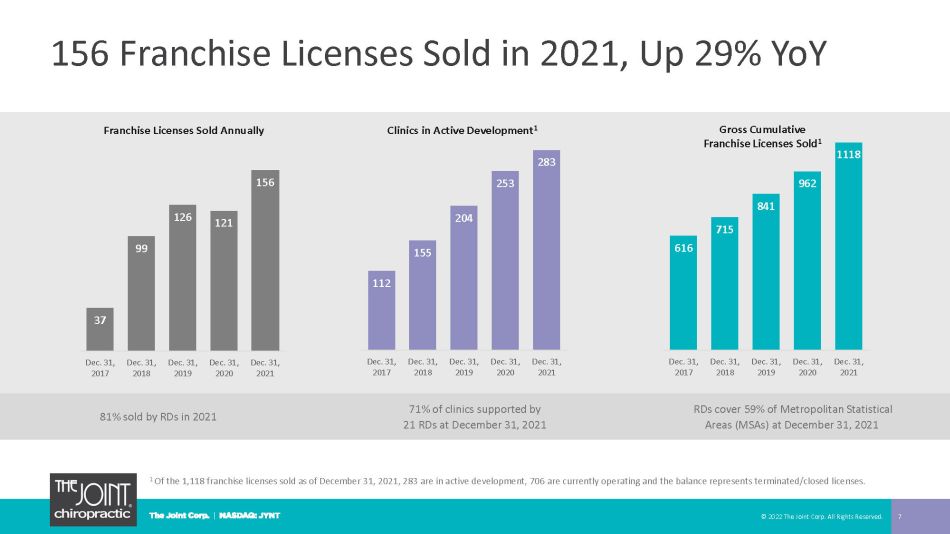
81% sold by RDs in 2021 71% of clinics supported by 21 RDs at December 31, 2021 RDs cover 59% of Metropolitan Statistical Areas (MSAs) at December 31, 2021 37 99 126 121 156 Dec. 31, 2017 Dec. 31, 2018 Dec. 31, 2019 Dec. 31, 2020 Dec. 31, 2021 616 715 841 962 1118 Dec. 31, 2017 Dec. 31, 2018 Dec. 31, 2019 Dec. 31, 2020 Dec. 31, 2021 112 155 204 253 283 Dec. 31, 2017 Dec. 31, 2018 Dec. 31, 2019 Dec. 31, 2020 Dec. 31, 2021 156 Franchise Licenses Sold in 2021, Up 29% YoY © 2022 The Joint Corp. All Rights Reserved. 7 1 Of the 1,118 franchise licenses sold as of December 31, 2021, 283 are in active development, 706 are currently operating and the balance represents terminated/closed licenses. Gross Cumulative Franchise Licenses Sold 1 Franchise Licenses Sold Annually Clinics in Active Development 1
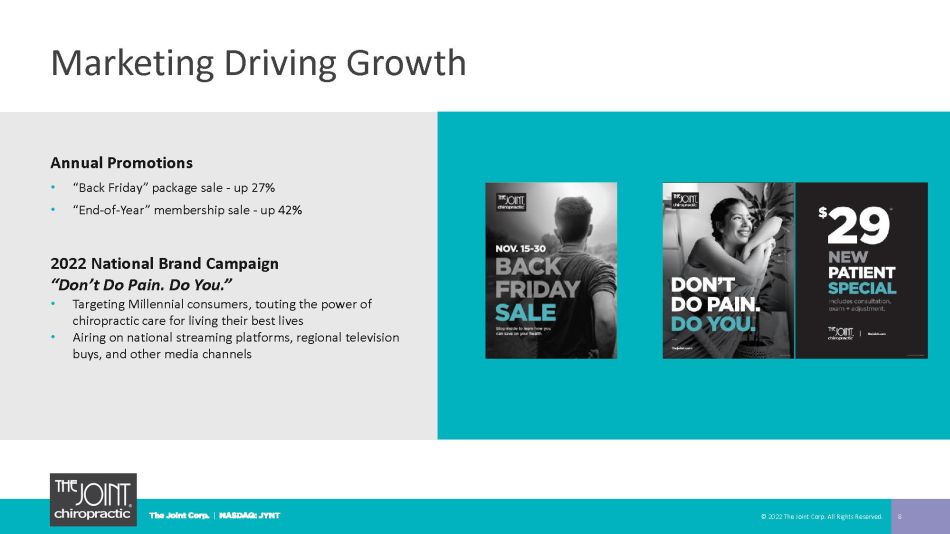
Marketing Driving Growth 8 © 2022 The Joint Corp. All Rights Reserved. Annual Promotions • “Back Friday” package sale - up 27% • “End - of - Year” membership sale - up 42% 2022 National Brand Campaign “Don’t Do Pain. Do You.” • Targeting Millennial consumers, touting the power of chiropractic care for living their best lives • Airing on national streaming platforms, regional television buys, and other media channels
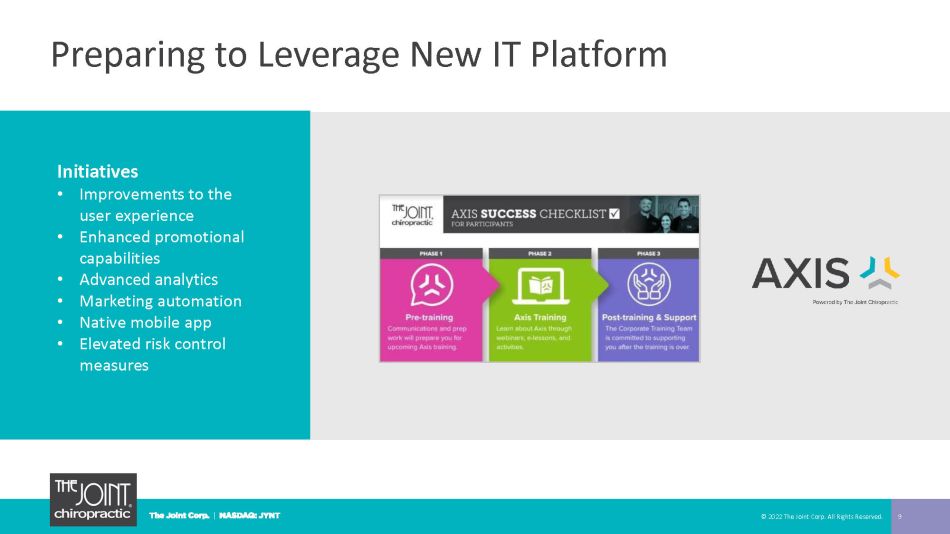
Preparing to Leverage New IT Platform © 2022 The Joint Corp. All Rights Reserved. 9 Initiatives • Improvements to the user experience • Enhanced promotional capabilities • Advanced analytics • Marketing automation • Native mobile app • Elevated risk control measures
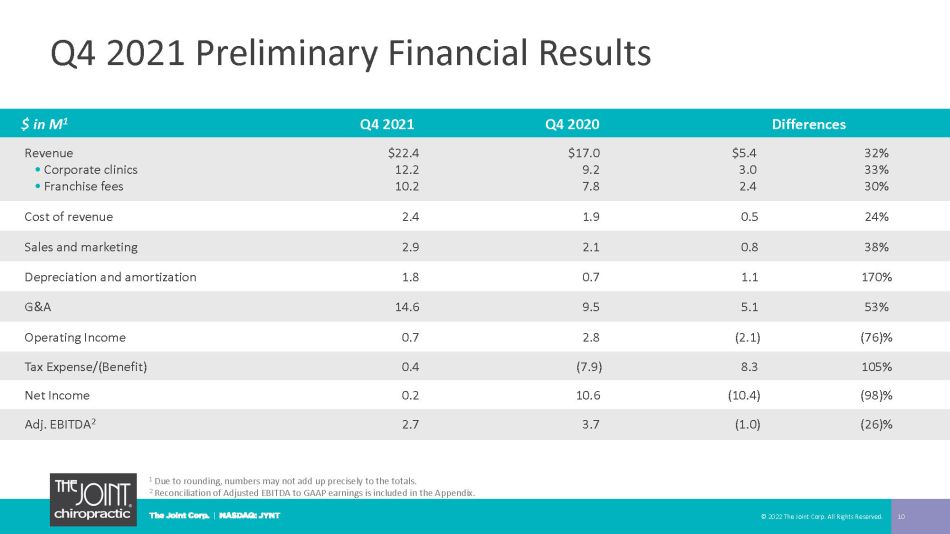
Q4 2021 Preliminary Financial Results 10 $ in M 1 Q4 2021 Q4 2020 Differences Revenue • Corporate clinics • Franchise fees $22.4 12.2 10.2 $17.0 9.2 7.8 $5.4 3.0 2.4 32% 33% 30% Cost of revenue 2.4 1.9 0.5 24% Sales and marketing 2.9 2.1 0.8 38% Depreciation and amortization 1.8 0.7 1.1 170% G&A 14.6 9.5 5.1 53% Operating Income 0.7 2.8 (2.1) (76)% Tax Expense/(Benefit) 0.4 (7.9) 8.3 105% Net Income 0.2 10.6 (10.4) (98)% Adj. EBITDA 2 2.7 3.7 (1.0) (26)% © 2022 The Joint Corp. All Rights Reserved. 1 Due to rounding, numbers may not add up precisely to the totals. 2 Reconciliation of Adjusted EBITDA to GAAP earnings is included in the Appendix.
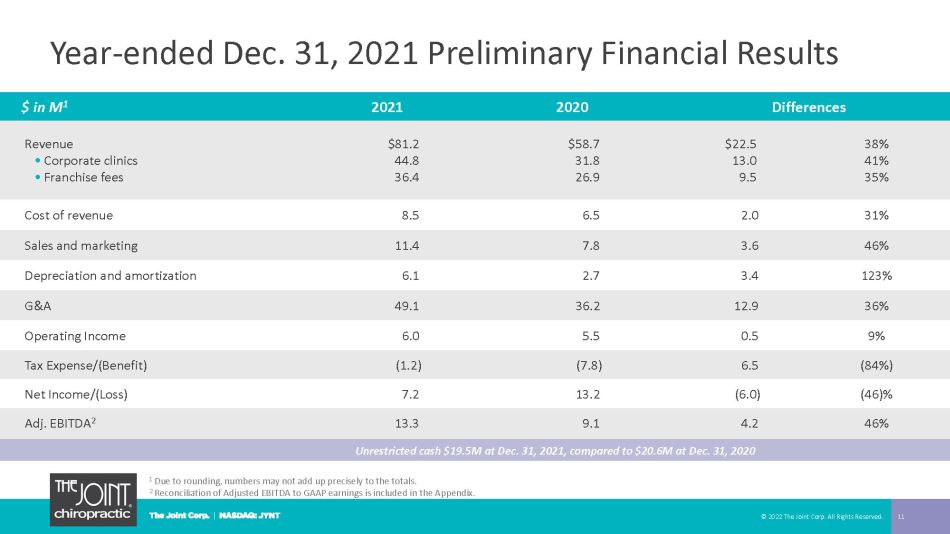
Year - ended Dec. 31, 2021 Preliminary Financial Results 11 $ in M 1 2021 2020 Differences Revenue • Corporate clinics • Franchise fees $81.2 44.8 36.4 $58.7 31.8 26.9 $22.5 13.0 9.5 38% 41% 35% Cost of revenue 8.5 6.5 2.0 31% Sales and marketing 11.4 7.8 3.6 46% Depreciation and amortization 6.1 2.7 3.4 123% G&A 49.1 36.2 12.9 36% Operating Income 6.0 5.5 0.5 9% Tax Expense/(Benefit) (1.2) (7.8) 6.5 (84%) Net Income/(Loss) 7.2 13.2 (6.0) (46)% Adj. EBITDA 2 13.3 9.1 4.2 46% 1 Due to rounding, numbers may not add up precisely to the totals. 2 Reconciliation of Adjusted EBITDA to GAAP earnings is included in the Appendix. © 2022 The Joint Corp. All Rights Reserved. Unrestricted cash $19.5 M at Dec. 31, 2021, compared to $20.6M at Dec. 31, 2020
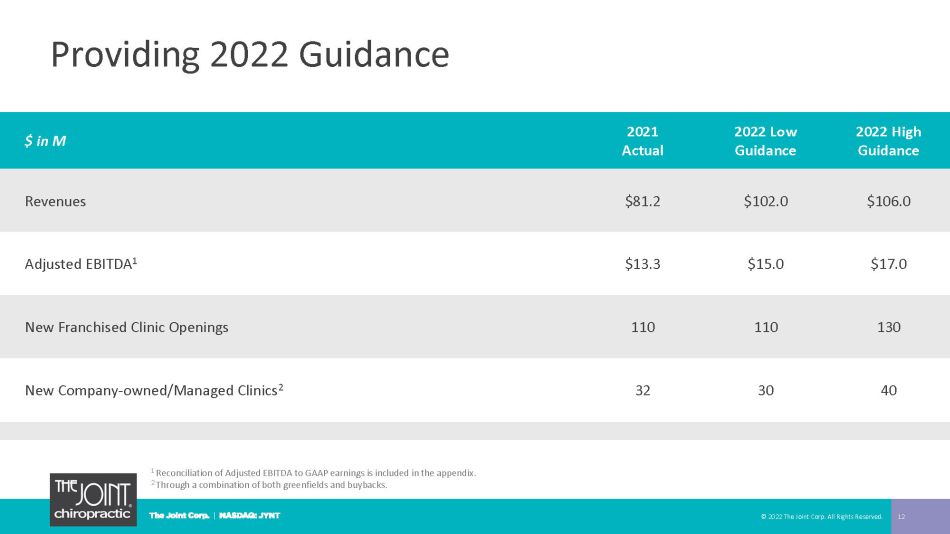
Providing 2022 Guidance 12 $ in M 2021 Actual 2022 Low Guidance 2022 High Guidance Revenues $81.2 $102.0 $106.0 Adjusted EBITDA 1 $13.3 $15.0 $17.0 New Franchised Clinic Openings 110 110 130 New Company - owned/Managed Clinics 2 32 30 40 © 2022 The Joint Corp. All Rights Reserved. 1 Reconciliation of Adjusted EBITDA to GAAP earnings is included in the appendix. 2 Through a combination of both greenfields and buybacks.
Advancing Growth Strategy © 2022 The Joint Corp. All Rights Reserved. 13 Forging the Chiropractic Dream Accelerating the Pace of Clinic Growth Harnessing the Power of Our Data
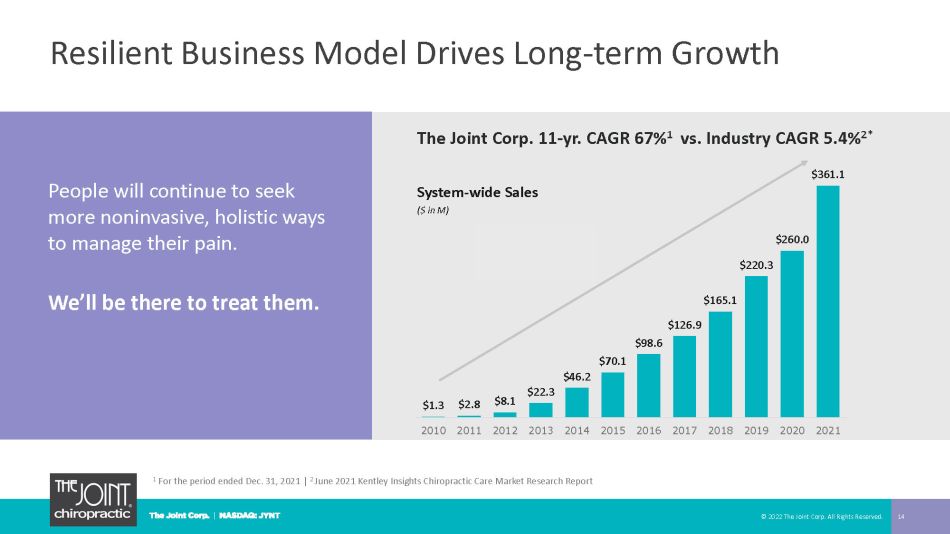
Resilient Business Model Drives Long - term Growth 14 People will continue to seek more noninvasive, holistic ways to manage their pain. We’ll be there to treat them. System - wide Sales ($ in M) 70% CAGR 1 (2010 - 2020) The Joint Corp. 11 - yr. CAGR 67% 1 vs. Industry CAGR 5.4% 2* 1 For the period ended Dec. 31, 2021 | 2 June 2021 Kentley Insights Chiropractic Care Market Research Report © 2022 The Joint Corp. All Rights Reserved. $1.3 $2.8 $8.1 $22.3 $46.2 $70.1 $98.6 $126.9 $165.1 $220.3 $260.0 $361.1 2010 2011 2012 2013 2014 2015 2016 2017 2018 2019 2020 2021
Non - GAAP Measure Definition 15 This presentation includes non - GAAP financial measures. System - wide sales include sales at all clinics, whether operated by the company or by fran chisees. While franchised sales are not recorded as revenues by the company, management believes the information is important in understandi ng the company’s financial performance, because these sales are the basis on which the company calculates and records royalty fees and are indicative of the financia l h ealth of the franchisee base. Comp sales include the sales from both company - owned or managed clinics and franchised clinics that in each case have been open at least 13 full months and exclude any clinics that have closed. EBITDA and Adjusted EBITDA are presented because they are important measures used by management to assess financial performan ce, as management believes they provide a more transparent view of the Company’s underlying operating performance and operating trends than GAAP measures alone. Reconciliat ion s of net loss to EBITDA and Adjusted EBITDA are presented where applicable. The Company defines EBITDA as net income/(loss) before net interes t, tax expense, depreciation, and amortization expenses. The Company defines Adjusted EBITDA as EBITDA before acquisition - related expenses, bargain purchase net gain, gain/(loss) on disposition or impairment, and stock - based compensation expenses. EBITDA and Adjusted EBITDA do not represent and should not be considered alternatives to net income or cash flows from operat ion s, as determined by accounting principles generally accepted in the United States, or GAAP. While EBITDA and Adjusted EBITDA are frequently used as measures of financial performance and the ability to meet debt service requirements, they are not necessarily comparable to other similarly titled captions of other companies due to potential inconsistencies in the methods of calculation. EBITDA and Adjusted EBITDA should be reviewed in conjunction with the Company’s financial statements fil ed with the SEC. © 2022 The Joint Corp. All Rights Reserved.
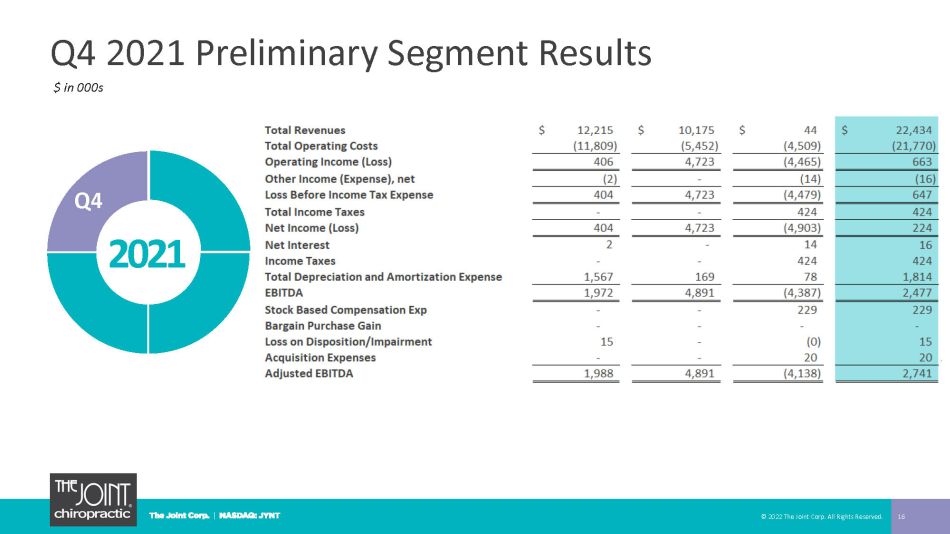
Q4 2021 Preliminary Segment Results 16 2021 Q4 © 2022 The Joint Corp. All Rights Reserved. $ in 000s
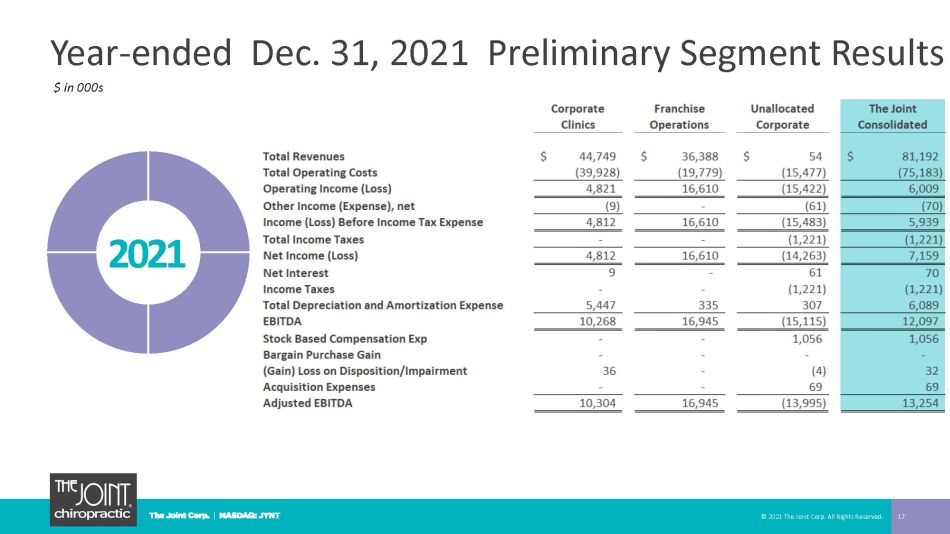
Year - ended Dec. 31, 2021 Preliminary Segment Results 17 2021 © 2021 The Joint Corp. All Rights Reserved. $ in 000s
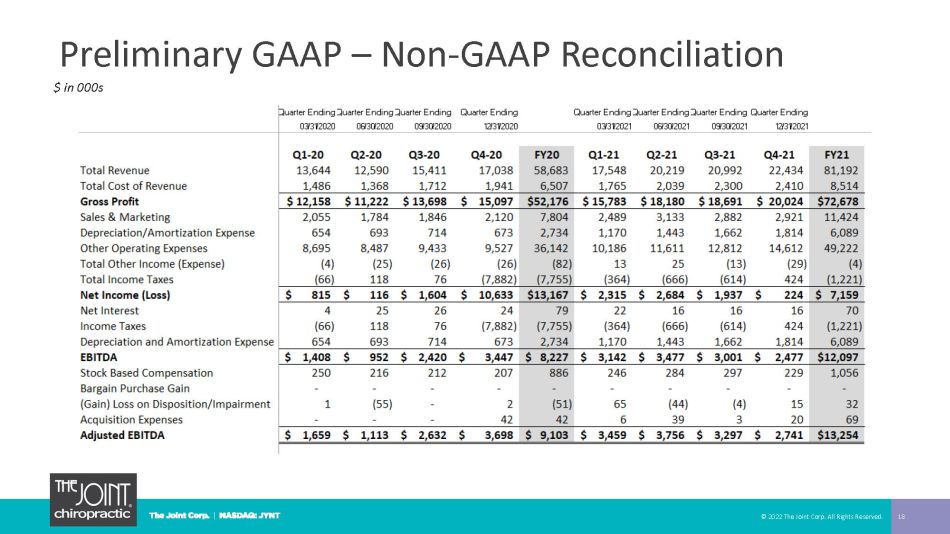
Preliminary GAAP – Non - GAAP Reconciliation 18 © 2022 The Joint Corp. All Rights Reserved. $ in 000s

Jake Singleton, CFO [email protected] The Joint Corp. | 16767 N. Perimeter Dr., Suite 110, Scottsdale, AZ 85260 | (480) 245 - 5960 https://www.facebook.com/thejointchiro @ thejointchiro https://twitter.com/thejointchiro @ thejointchiro https://www.youtube.com/thejointcorp @ thejointcorp Peter D. Holt, President and CEO [email protected] The Joint Corp. | 16767 N. Perimeter Dr., Suite 110, Scottsdale, AZ 85260 | (480) 245 - 5960 Kirsten Chapman, LHA Investor Relations [email protected] LHA Investor Relations | One Market Street, Spear Tower, Suite 3600, San Francisco, CA 94105 | (415) 433 - 3777 © 2022 The Joint Corp. All Rights Reserved. 19 The Joint Corp. Contact Information