
Exhibit 99.2
© 2021 The Joint Corp. All Rights Reserved. 1 Q2 2021 Financial Results As of June 30, 2021 | Reported on August 5, 2021
Safe Harbor Statement © 2021 The Joint Corp. All Rights Reserved. 2 Certain statements contained in this presentation are "forward - looking statements” about future events and expectations. Forward - looking statements are based on our beliefs, assumptions and expectations of industry trends, our future financial and operating performance and our growth plans, taking into account the in formation currently available to us. These statements are not statements of historical fact. Forward - looking statements involve risks and uncertainties that may cause our actual results to differ material ly from the expectations of future results we express or imply in any forward - looking statements, and you should not place undue reliance on such statements. Factors that could contribute to these differ enc es include, but are not limited to, the continuing impact of the COVID - 19 outbreak on the economy and our operations (including temporary clinic closures, shortened business hours and reduced patient de mand), our failure to develop or acquire company - owned or managed clinics as rapidly as we intend, our failure to profitably operate company - owned or managed clinics, and the other factors descr ibed in “Risk Factors” in our Annual Report on Form 10 - K as filed with the SEC for the year ended December 31, 2020, as updated or revised for any material changes described in any subsequently - filed Quarter ly Reports on Form 10 - Q or other SEC filings. We anticipate filing our Quarterly Report on Form 10 - Q for the quarter ended June 30, 2021 on or around August 6, 2021. Words such as, "anticipates," "be lieves," "continues," "estimates," "expects," "goal," "objectives," "intends," "may," "opportunity," "plans," "potential," "near - term," "long - term," "projections," "assumptions," "projects," "guid ance," "forecasts," "outlook," "target," "trends," "should," "could," "would," "will," and similar expressions are intended to identify such forward - looking statements. We qualify any forward - looking stateme nts entirely by these cautionary factors. We assume no obligation to update or revise any forward - looking statements for any reason or to update the reasons actual results could differ materially from tho se anticipated in these forward - looking statements, even if new information becomes available in the future. Comparisons of results for current and any prior periods are not intended to express any fut ure trends or indications of future performance, unless expressed as such, and should only be viewed as historical data. Business Structure The Joint Corp. is a franchisor of clinics and an operator of clinics in certain states. In Arkansas, California, Colorado, D ist rict of Columbia, Florida, Illinois, Kansas, Kentucky, Maryland, Massachusetts, Michigan, Minnesota, New Jersey, New York, North Carolina, Oregon, Pennsylvania, Rhode Island, South Dakota, Tennessee, Washi ngt on, West Virginia and Wyoming, The Joint Corp. and its franchisees provide management services to affiliated professional chiropractic practices.
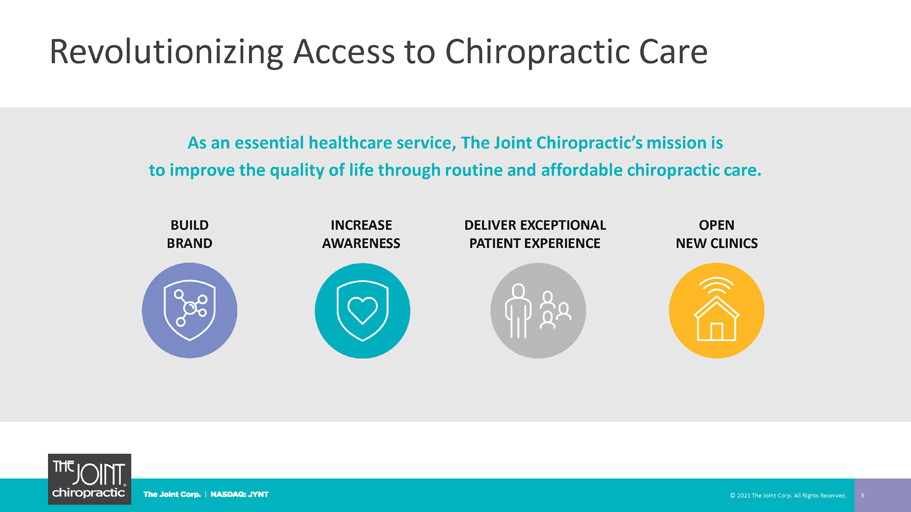
© 2021 The Joint Corp. All Rights Reserved. 3 BUILD BRAND INCREASE AWARENESS DELIVER EXCEPTIONAL PATIENT EXPERIENCE OPEN NEW CLINICS Revolutionizing Access to Chiropractic Care As an essential healthcare service, The Joint Chiropractic’s mission is to improve the quality of life through routine and affordable chiropractic care.
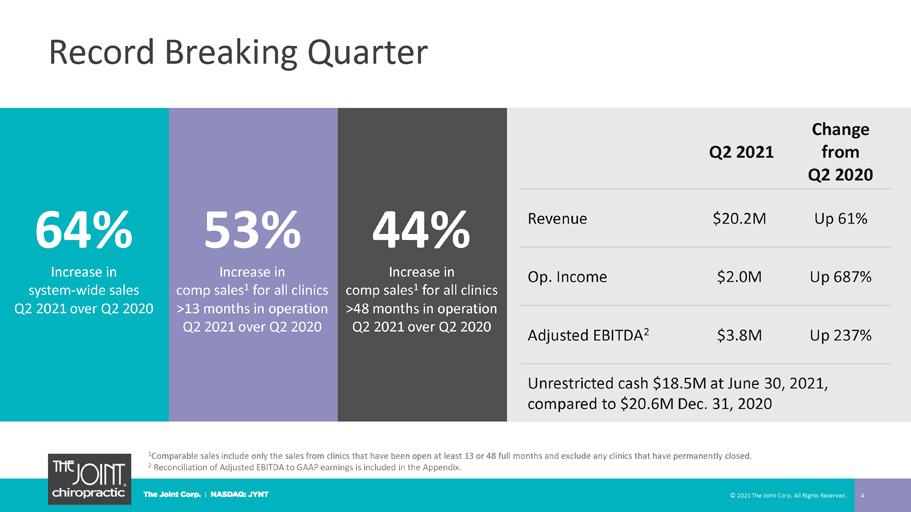
Record Breaking Quarter 4 Q2 2021 Change from Q2 2020 Revenue $20.2M Up 61% Op. Income $2.0M Up 687% Adjusted EBITDA 2 $3.8M Up 237% Unrestricted cash $18.5 M at June 30, 2021, compared to $20.6M Dec. 31, 2020 © 2021 The Joint Corp. All Rights Reserved. 1 Comparable sales include only the sales from clinics that have been open at least 13 or 48 full months and exclude any clinics that have permanently closed. 2 Reconciliation of Adjusted EBITDA to GAAP earnings is included in the Appendix. 64 % Increase in sy stem - wide sales Q2 2021 over Q2 2020 53% In crease in comp sales 1 for all clinics >13 months in operation Q2 2021 over Q2 2020 44% In crease in comp sales 1 for all clinics >48 months in operation Q2 2021 over Q2 2020
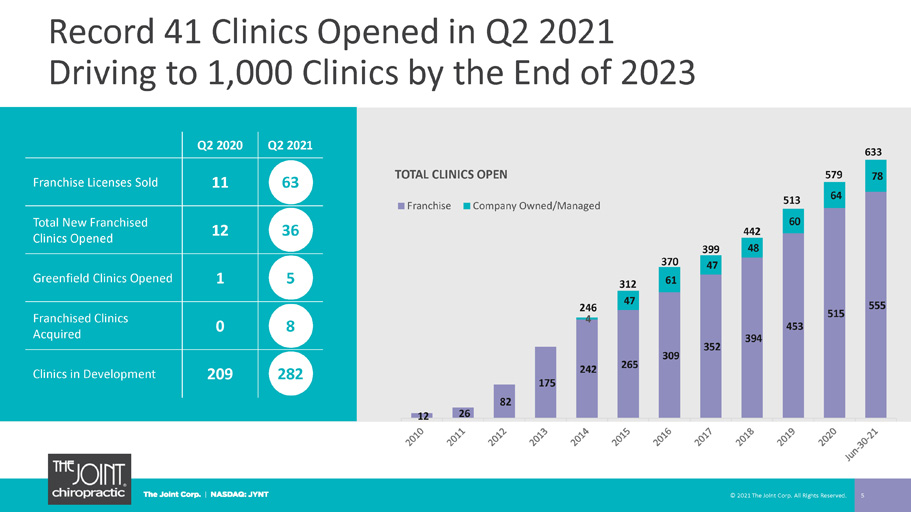
Record 41 Clinics Opened in Q2 2021 Driving to 1,000 Clinics by the End of 2023 12 26 82 175 242 265 309 352 394 453 515 555 4 47 61 47 48 60 64 78 TOTAL CLINICS OPEN Franchise Company Owned/Managed © 2021 The Joint Corp. All Rights Reserved. 5 Q2 2020 Q2 2021 Franchise Licenses Sold 11 63 Total New Franchised Clinics Opened 12 36 Greenfield Clinics Opened 1 5 Franchised Clinics Acquired 0 8 Clinics in Development 209 282 370 399 442 513 312 246 579 633
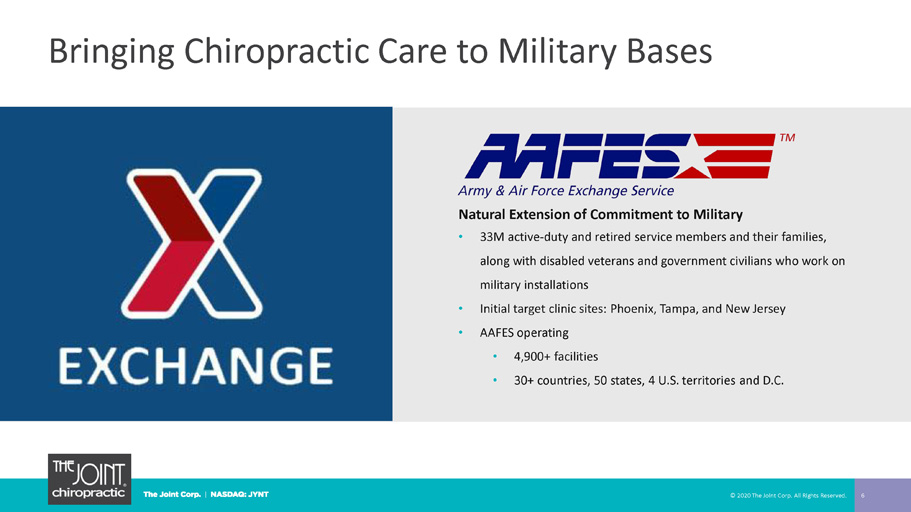
Bringing Chiropractic C are to Military Bases © 2020 The Joint Corp. All Rights Reserved. 6 Natural Extension of Commitment to Military • 33M active - duty and retired service members and their families, along with disabled veterans and government civilians who work on military installations • I nitial target clinic sites: Phoenix, Tampa, and New Jersey • AAFES o perating • 4,900+ facilities • 30+ countries, 50 states, 4 U.S. territories and D.C.
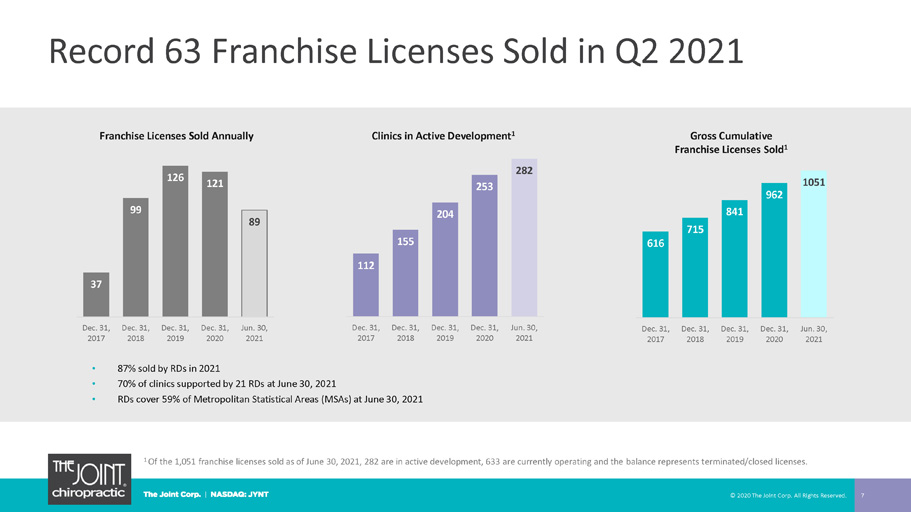
37 99 126 121 89 Dec. 31, 2017 Dec. 31, 2018 Dec. 31, 2019 Dec. 31, 2020 Jun. 30, 2021 616 715 841 962 1051 Dec. 31, 2017 Dec. 31, 2018 Dec. 31, 2019 Dec. 31, 2020 Jun. 30, 2021 112 155 204 253 282 Dec. 31, 2017 Dec. 31, 2018 Dec. 31, 2019 Dec. 31, 2020 Jun. 30, 2021 Record 63 Franchise Licenses Sold in Q2 2021 © 2020 The Joint Corp. All Rights Reserved. 7 1 Of the 1,051 franchise licenses sold as of June 30, 2021, 282 are in active development, 633 are currently operating and the bal ance represents terminated/closed licenses. • 87% sold by RDs in 2021 • 70% of clinics supported by 21 RDs at June 30, 2021 • RDs cover 59% of Metropolitan Statistical Areas (MSAs) at June 30, 2021 Gross Cumulative Franchise Licenses Sold 1 Franchise Licenses Sold Annually Clinics in Active Development 1
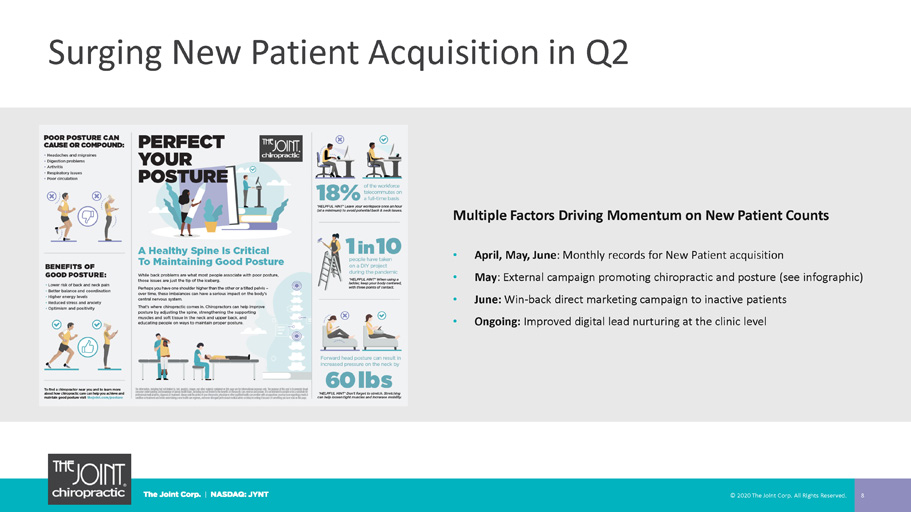
Surging New Patient Acquisition in Q2 © 2020 The Joint Corp. All Rights Reserved. 8 Multiple Factors Driving Momentum on New Patient Counts • April, May, June : Monthly records for New Patient acquisition • May : External campaign promoting chiropractic and posture (see infographic) • June: Win - back direct marketing campaign to inactive patients • Ongoing: Improved digital lead nurturing at the clinic level
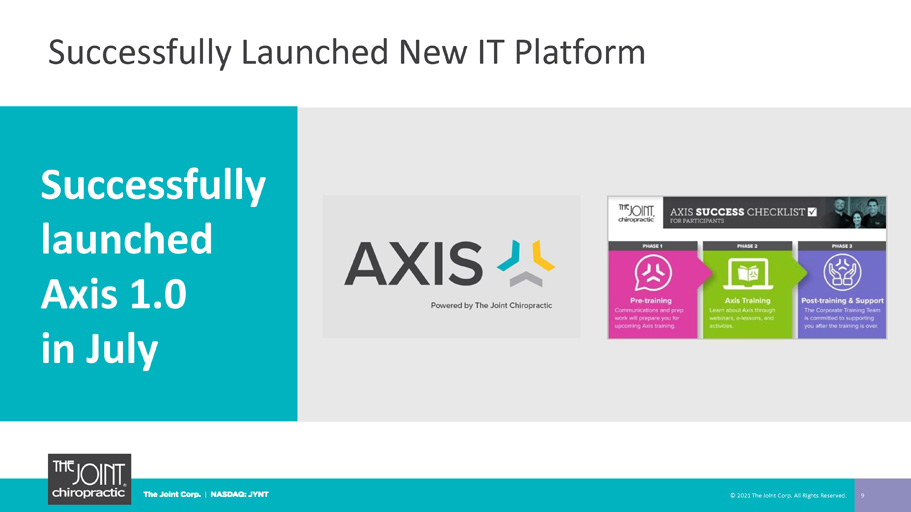
Successfully Launched New IT Platform 9 Successfully launched Axis 1.0 in July © 2021 The Joint Corp. All Rights Reserved.
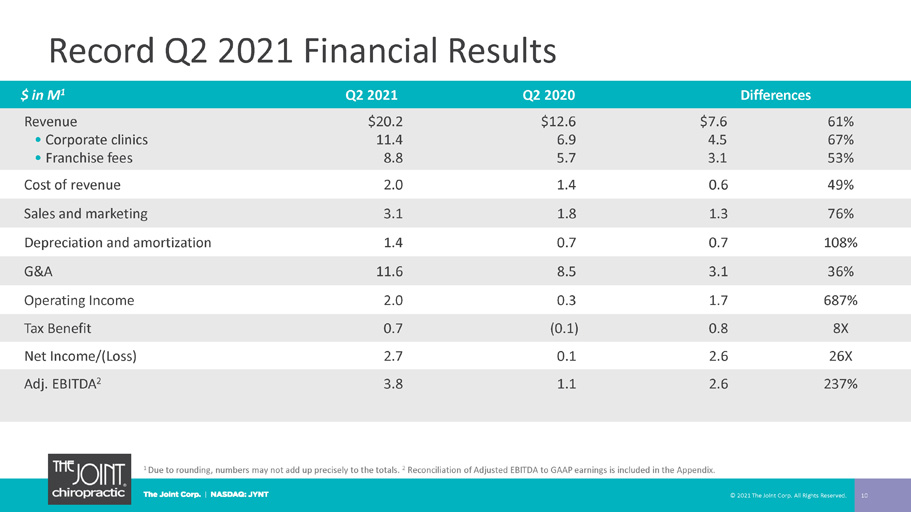
Record Q2 2021 Financial Results 10 $ in M 1 Q2 2021 Q2 2020 Differences Revenue • Corporate clinics • Franchise fees $20.2 11.4 8.8 $12.6 6.9 5.7 $7.6 4.5 3.1 61% 67% 53% Cost of revenue 2.0 1.4 0.6 49% Sales and marketing 3.1 1.8 1.3 76% Depreciation and amortization 1.4 0.7 0.7 108% G&A 11.6 8.5 3.1 36% Operating Income 2.0 0.3 1.7 687% Tax Benefit 0.7 (0.1) 0.8 8X Net Income/(Loss) 2.7 0.1 2.6 26X Adj. EBITDA 2 3.8 1.1 2.6 237% © 2021 The Joint Corp. All Rights Reserved. 1 Due to rounding, numbers may not add up precisely to the totals. 2 Reconciliation of Adjusted EBITDA to GAAP earnings is included in the Appendix.
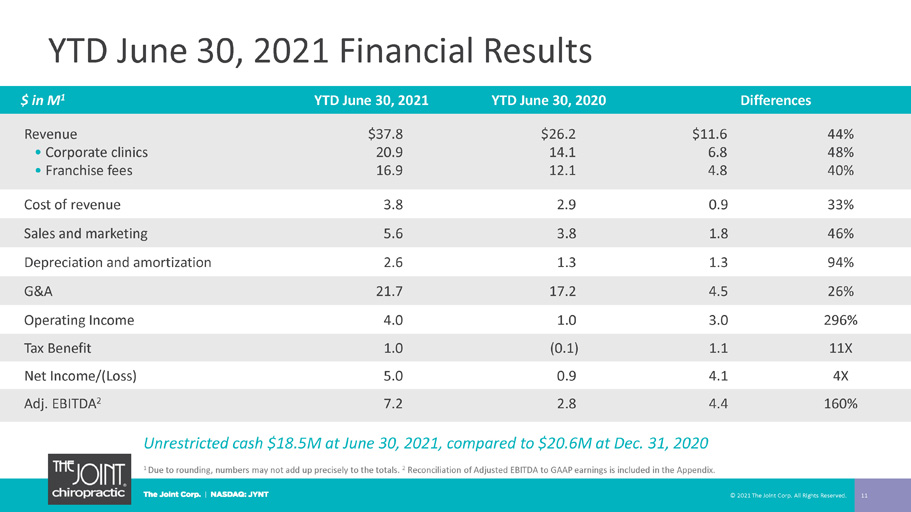
YTD June 30, 2021 Financial Results 11 $ in M 1 YTD June 30, 2021 YTD June 30, 2020 Differences Revenue • Corporate clinics • Franchise fees $37.8 20.9 16.9 $26.2 14.1 12.1 $11.6 6.8 4.8 44% 48% 40% Cost of revenue 3.8 2.9 0.9 33% Sales and marketing 5.6 3.8 1.8 46% Depreciation and amortization 2.6 1.3 1.3 94% G&A 21.7 17.2 4.5 26% Operating Income 4.0 1.0 3.0 296% Tax Benefit 1.0 (0.1) 1.1 11X Net Income/(Loss) 5.0 0.9 4.1 4X Adj. EBITDA 2 7.2 2.8 4.4 160% 1 Due to rounding, numbers may not add up precisely to the totals. 2 Reconciliation of Adjusted EBITDA to GAAP earnings is included in the Appendix. © 2021 The Joint Corp. All Rights Reserved. Unrestricted cash $18.5 M at June 30, 2021, compared to $20.6M at Dec. 31, 2020
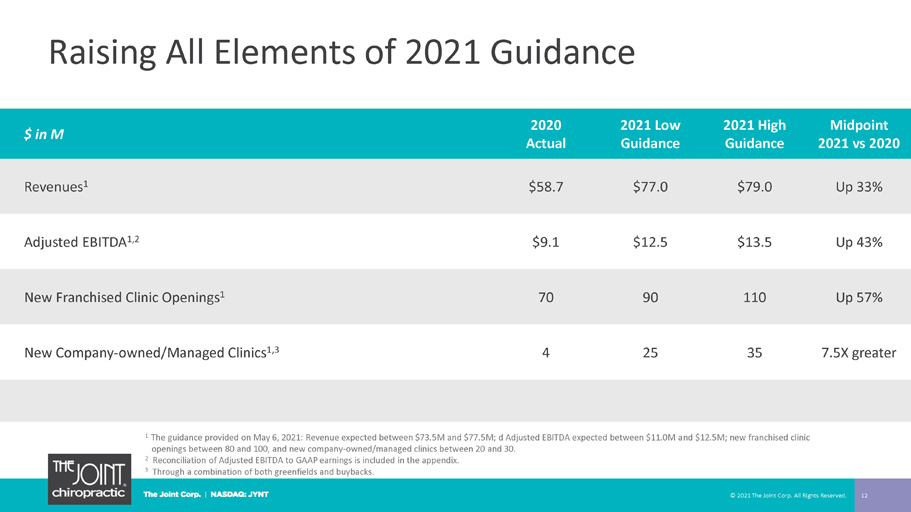
Raising All Elements of 2021 Guidance 12 $ in M 2020 Actual 2021 Low Guidance 2021 High Guidance Midpoint 2021 vs 2020 Revenues 1 $58.7 $77.0 $79.0 Up 33% Adjusted EBITDA 1,2 $9.1 $12.5 $13.5 Up 43% New Franchised Clinic Openings 1 70 90 110 Up 57% New Company - owned/Managed Clinics 1,3 4 25 35 7.5X greater © 2021 The Joint Corp. All Rights Reserved. 1 The guidance provided on May 6, 2021: Revenue expected between $73.5M and $77.5M; d Adjusted EBITDA expected between $11.0M a nd $12.5M ; new franchised clinic openings between 80 and 100, and new company - owned/managed clinics between 20 and 30. 2 Reconciliation of Adjusted EBITDA to GAAP earnings is included in the appendix. 3 Through a combination of both greenfields and buybacks.
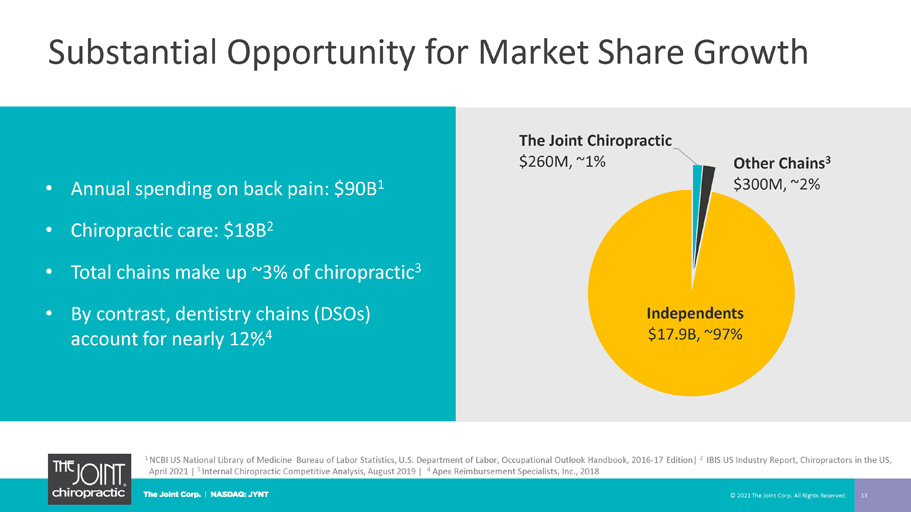
Substantial Opportunity for Market Share Growth © 2021 The Joint Corp. All Rights Reserved. 13 1 NCBI US National Library of Medicine Bureau of Labor Statistics, U.S. Department of Labor, Occupational Outlook Handbook, 20 16 - 17 Edition| 2 IBIS US Industry Report, Chiropractors in the US, April 2021 | 3 Internal Chiropractic Competitive Analysis, August 2019 | 4 Apex Reimbursement Specialists, Inc., 2018 The Joint Chiropractic $260M, ~ 1% Other Chains 3 $300M, ~ 2% Independents $17.9B, ~ 97% • Annual spending on back pain: $90B 1 • Chiropractic care: $18B 2 • Total chains make up ~3% of chiropractic 3 • By contrast, dentistry chains (DSOs) account for nearly 12% 4
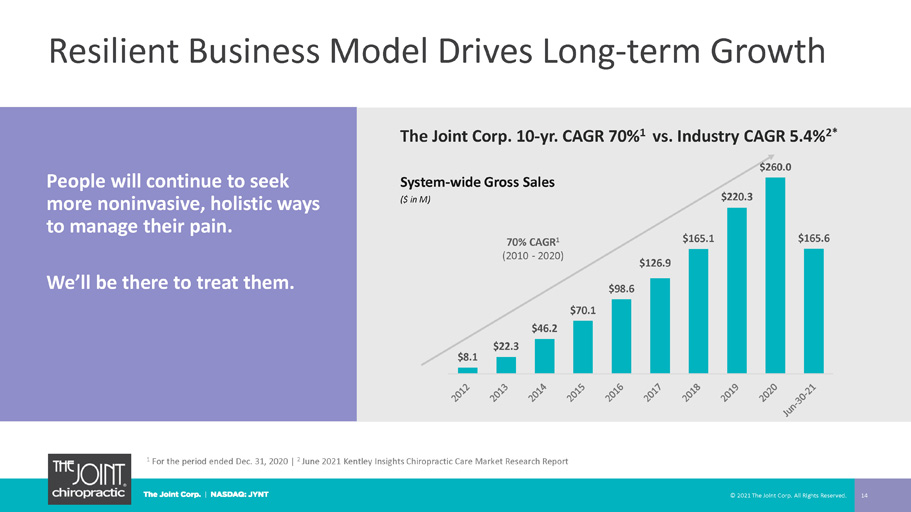
Resilient Business Model Drives Long - term Growth 14 People will continue to seek more noninvasive, holistic ways to manage their pain. We’ll be there to treat them. System - wide Gross Sales ($ in M) 70% CAGR 1 (2010 - 2020) The Joint Corp. 10 - yr. CAGR 70% 1 vs. Industry CAGR 5.4% 2* 1 For the period ended Dec. 31, 2020 | 2 June 2021 Kentley Insights Chiropractic Care Market Research Report © 2021 The Joint Corp. All Rights Reserved. $8.1 $22.3 $46.2 $70.1 $98.6 $126.9 $165.1 $220.3 $260.0 $165.6
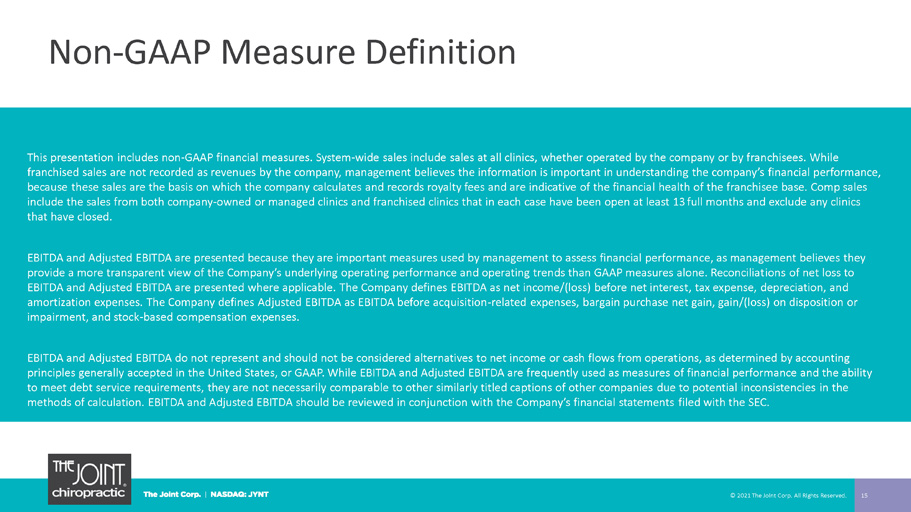
Non - GAAP Measure Definition 15 This presentation includes non - GAAP financial measures. System - wide sales include sales at all clinics, whether operated by the company or by fran chisees. While franchised sales are not recorded as revenues by the company, management believes the information is important in understandi ng the company’s financial performance, because these sales are the basis on which the company calculates and records royalty fees and are indicative of the financia l h ealth of the franchisee base. Comp sales include the sales from both company - owned or managed clinics and franchised clinics that in each case have been open at least 13 full months and exclude any clinics that have closed. EBITDA and Adjusted EBITDA are presented because they are important measures used by management to assess financial performan ce, as management believes they provide a more transparent view of the Company’s underlying operating performance and operating trends than GAAP measures alone. Reconciliat ion s of net loss to EBITDA and Adjusted EBITDA are presented where applicable. The Company defines EBITDA as net income/(loss) before net interes t, tax expense, depreciation, and amortization expenses. The Company defines Adjusted EBITDA as EBITDA before acquisition - related expenses, bargain purchase net gain, gain/(loss) on disposition or impairment, and stock - based compensation expenses. EBITDA and Adjusted EBITDA do not represent and should not be considered alternatives to net income or cash flows from operat ion s, as determined by accounting principles generally accepted in the United States, or GAAP. While EBITDA and Adjusted EBITDA are frequently used as measures of financial performance and the ability to meet debt service requirements, they are not necessarily comparable to other similarly titled captions of other companies due to potential inconsistencies in the methods of calculation. EBITDA and Adjusted EBITDA should be reviewed in conjunction with the Company’s financial statements fil ed with the SEC. © 2021 The Joint Corp. All Rights Reserved.
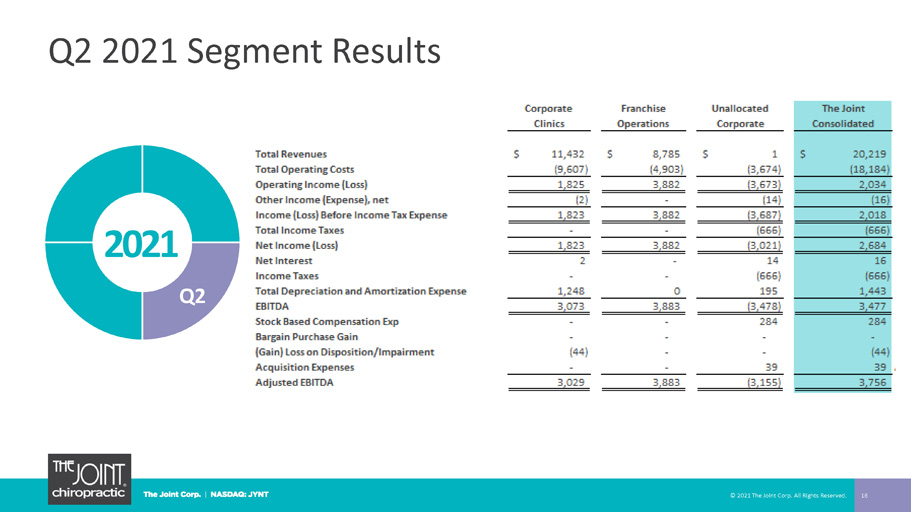
Q2 2021 Segment Results 16 2021 Q2 © 2021 The Joint Corp. All Rights Reserved.
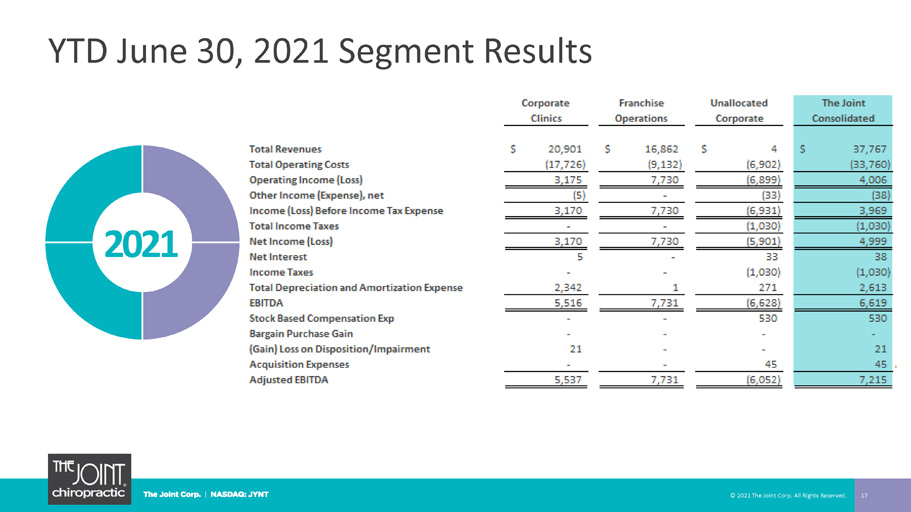
YTD June 30, 2021 Segment Results 17 2021 © 2021 The Joint Corp. All Rights Reserved.
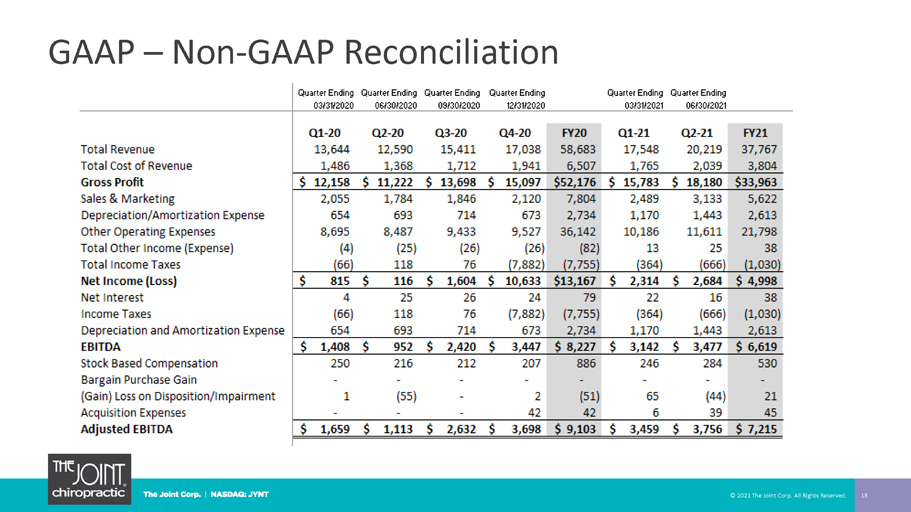
GAAP – Non - GAAP Reconciliation 18 © 2021 The Joint Corp. All Rights Reserved.

Jake Singleton, CFO jake.singleton@thejoint.com The Joint Corp. | 16767 N. Perimeter Dr., Suite 110, Scottsdale, AZ 85260 | (480) 245 - 5960 https://www.facebook.com/thejointchiro @ thejointchiro https://twitter.com/thejointchiro @ thejointchiro https://www.youtube.com/thejointcorp @ thejointcorp Peter D. Holt, President and CEO peter.holt@thejoint.com The Joint Corp. | 16767 N. Perimeter Dr., Suite 110, Scottsdale, AZ 85260 | (480) 245 - 5960 Kirsten Chapman, LHA Investor Relations thejoint@lhai.com LHA Investor Relations | One Market Street, Spear Tower, Suite 3600, San Francisco, CA 94105 | (415) 433 - 3777 19 The Joint Corp. Contact Information © 2021 The Joint Corp. All Rights Reserved.