
Exhibit 99.2
© 2020 The Joint Corp. All Rights Reserved. 1 Q2 2020 Financial Results As of June 30, 2020 | Reported on August 6, 2020
Safe Harbor Statement © 2020 The Joint Corp. All Rights Reserved. 2 Certain statements contained in this presentation are "forward - looking statements." We have tried to identify these forward - look ing statements by using words such as "may," "might," " will," "expect,” "anticipate,'' "'believe,“ "could," " intend," "plan," "estimate," "should," "if,“ "project," and similar expressions. All st ate ments other than statements of historical facts contained in this presentation, including statements regarding our growth strategies, our vision, future operations, future financial position, future revenu e, projected costs, prospects, plans, objectives of management and expected market growth and potential are forward - looking statements. We have based these forward - looking statements on our current expect ations and projections about future events. However, these forward - looking statements are subject to risks, uncertainties, assumptions and other factors that may cause our actual results, perf orm ance or achievements to be materially different from our expectations and projections. Some of these risks, uncertainties and other factors are set forth in this presentation and in other documents that we file w ith the United States Securities and Exchange Commission (the “SEC”), including those described in “Risk Factors” in our Annual Report on Form 10 - K for the year ended December 31, 2019 filed with th e SEC March 6, 2020, as revised or updated for any material changes described in any subsequently - filed Quarterly Reports on Form 10 - Q, including the one we anticipate filing with the SEC on Augus t 7, 2020. These risk factors include, but are not limited to, the continuing impact of the COVID - 19 outbreak on the economy and our operations (including temporary clinic closures, shortened business hours and reduced patient demand) our failure to develop or acquire company - owned or managed clinics as rapidly as we intend, our failure to profitably operate company - owned or managed clinics. Given thes e risks and uncertainties, readers are cautioned not to place undue reliance on our forward - looking statements. Projections and other forward - looking statements included in this presentation have been prepared based on assumptions, which we believe to be reasonable, but not in accordance with U.S. Generally Accepted Accounting Principals (“GAAP”) or any guidelines of the SEC. Actual results may vary, pe rhaps materially. You are strongly cautioned not to place undue reliance on such projections and other forward - looking statements. All subsequent written and oral forward - looking statements attributable u s or to persons acting on our behalf are expressly qualified in their entirety by these cautionary statements. Except as required by federal securities laws, we disclaim any intention or obligation to upd ate or revise any forward - looking statements, whether as a result of new information, future events or otherwise. Any such forward - looking statements, whether made in this presentation or elsewhere, sh ould be considered in the context of the various disclosures made by us. Business Structure The Joint Corp. is a franchisor of clinics and an operator of clinics in certain states. In Arkansas, California, Colorado, D ist rict of Columbia, Florida, Illinois, Kansas, Kentucky, Maryland, Massachusetts, Michigan, Minnesota, New Jersey, New York, North Carolina, Oregon, Pennsylvania, Rhode Island, South Dakota, Tennessee, Washi ngt on, West Virginia and Wyoming, The Joint Corp. and its franchisees provide management services to affiliated professional chiropractic practices.
© 2019 The Joint Corp. All Rights Reserved. 3 BUILD BRAND INCREASE AWARENESS ATTRACT NEW PATIENTS OPEN NEW CLINICS Our Mission is to Improve Quality of Life through Routine and Affordable Chiropractic Care Live a Better You
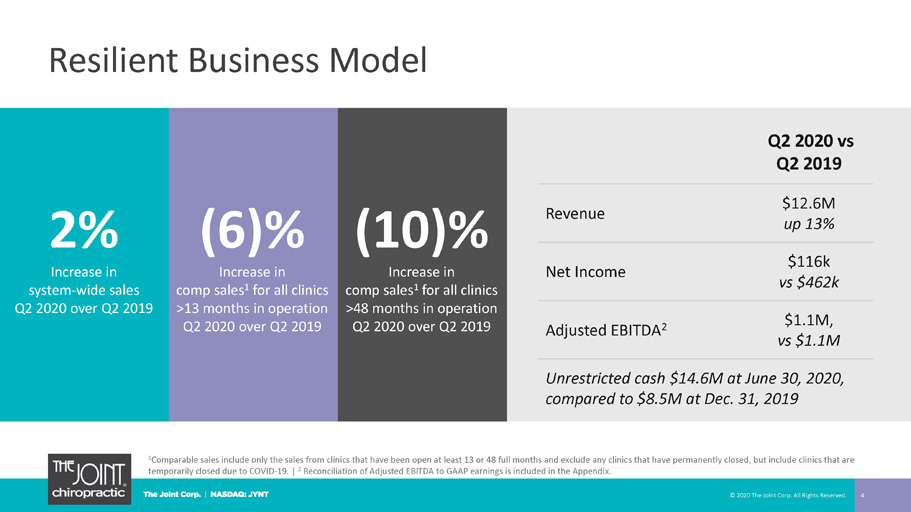
Resilient Business Model 4 Q2 2020 vs Q2 2019 Revenue $12.6M up 13% Net Income $116k vs $462k Adjusted EBITDA 2 $1.1M, vs $1.1M Unrestricted cash $14.6 M at June 30, 2020, compared to $8.5M at Dec. 31, 2019 1 Comparable sales include only the sales from clinics that have been open at least 13 or 48 full months and exclude any clinic s t hat have permanently closed, but include clinics that are temporarily closed due to COVID - 19. | 2 Reconciliation of Adjusted EBITDA to GAAP earnings is included in the Appendix. © 2020 The Joint Corp. All Rights Reserved. 2% Increase in sy stem - wide sales Q2 2020 over Q2 2019 (6)% Increase in comp sales 1 for all clinics >13 months in operation Q2 2020 over Q2 2019 (10)% Increase in comp sales 1 for all clinics >48 months in operation Q2 2020 over Q2 2019

12 26 82 175 242 265 309 352 394 453 477 4 47 61 47 48 60 62 2010 2011 2012 2013 2014 2015 2016 2017 2018 2019 30-Jun-20 TOTAL CLINICS OPEN Franchise Company Owned/Managed Continued Clinic Growth © 2020 The Joint Corp. All Rights Reserved. 5 370 399 513 539 312 246 Opened greenfields in February, June and July, bringing the corporate portfolio count to 63 as of August 6, 2020 Targeting 1,000 Clinics Opened by the end of 2023 442
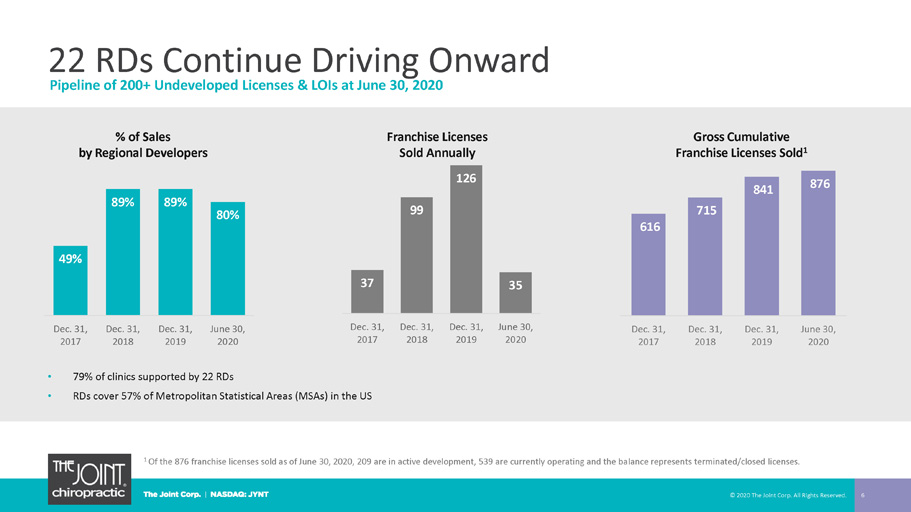
22 RDs Continue Driving Onward 6 1 Of the 876 franchise licenses sold as of June 30, 2020, 209 are in active development, 539 are currently operating and the ba lan ce represents terminated/closed licenses. • 79% of clinics supported by 22 RDs • RDs cover 57% of Metropolitan Statistical Areas (MSAs) in the US Pipeline of 200+ Undeveloped Licenses & LOIs at June 30, 2020 % of Sales by Regional Developers Gross Cumulative Franchise Licenses Sold 1 37 99 126 35 Dec. 31, 2017 Dec. 31, 2018 Dec. 31, 2019 June 30, 2020 Franchise Licenses Sold Annually © 2020 The Joint Corp. All Rights Reserved. 49% 89% 89% 80% Dec. 31, 2017 Dec. 31, 2018 Dec. 31, 2019 June 30, 2020 616 715 841 876 Dec. 31, 2017 Dec. 31, 2018 Dec. 31, 2019 June 30, 2020
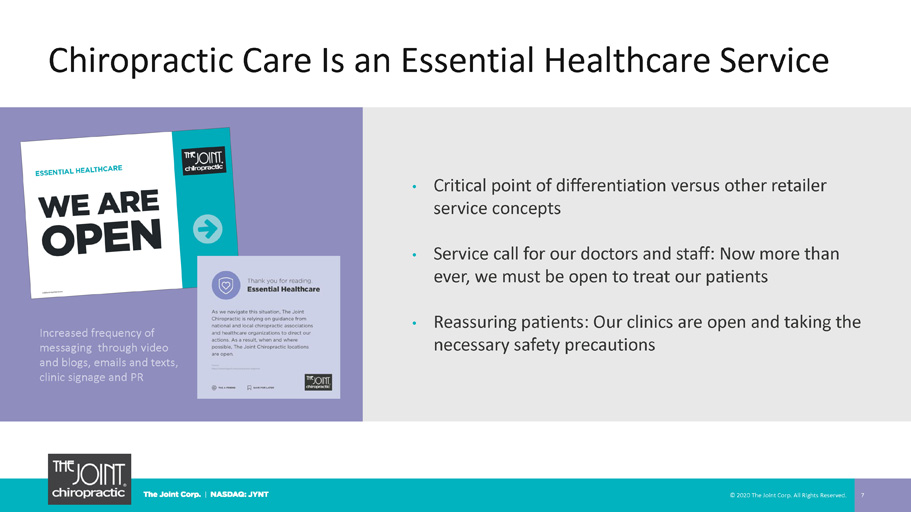
Chiropractic Care Is an Essential Healthcare Service © 2020 The Joint Corp. All Rights Reserved. 7 • Critical point of differentiation versus other retailer service concepts • Service call for our doctors and staff: Now more than ever, we must be open to treat our patients • Reassuring patients: Our clinics are open and taking the necessary safety precautions Increased frequency of messaging through video and blogs, emails and texts, clinic signage and PR
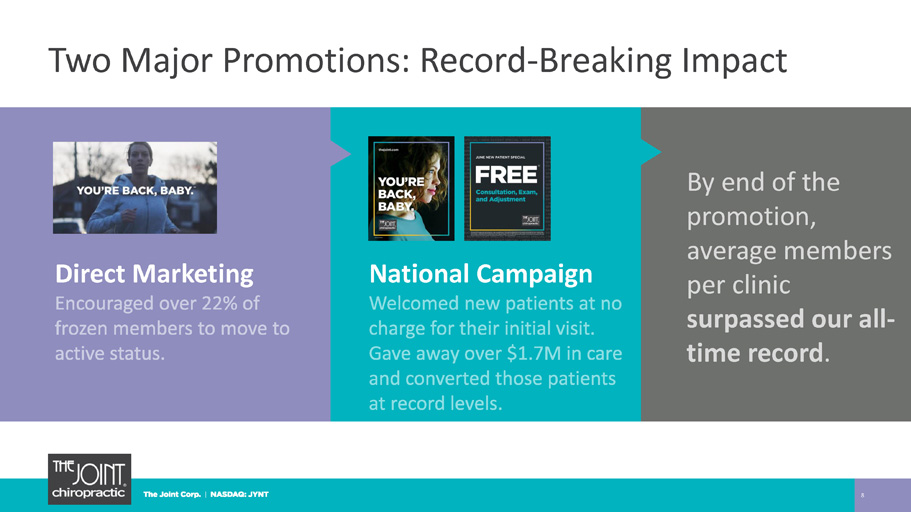
Two Major Promotions: Record - Breaking Impact 8 Direct Marketing By end of the promotion, average members per clinic surpassed our all - time record . National Campaign
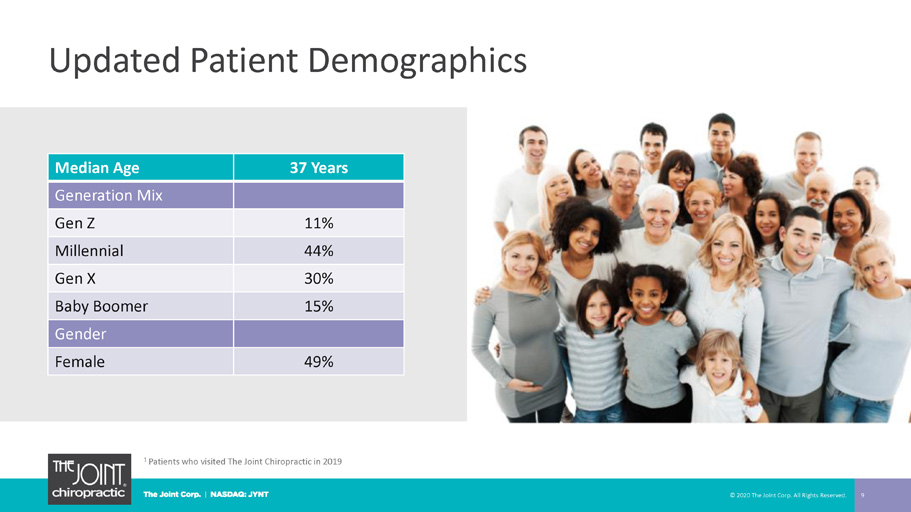
Updated Patient Demographics © 2020 The Joint Corp. All Rights Reserved. 9 1 Patients who visited The Joint Chiropractic in 2019 Median Age 37 Years Generation Mix Gen Z 11% Millennial 44% Gen X 30% Baby Boomer 15% Gender Female 49%
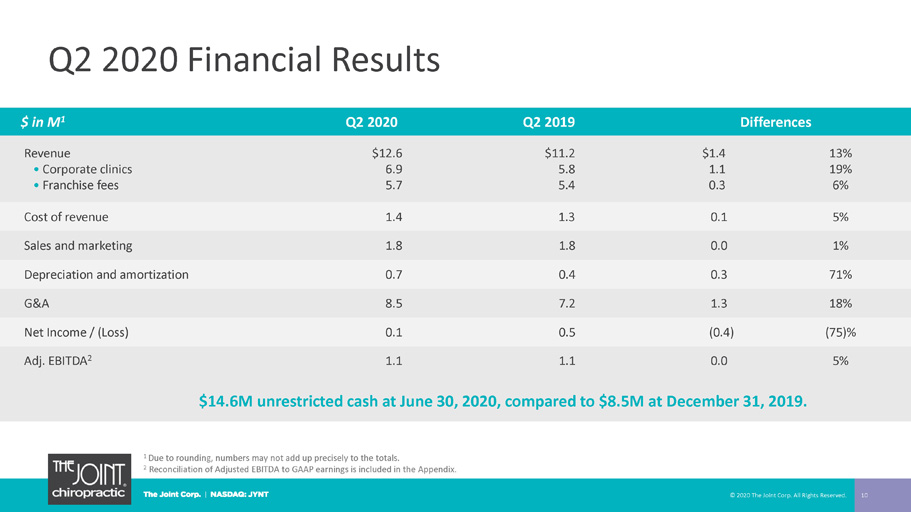
Q2 2020 Financial Results 10 $ in M 1 Q2 2020 Q2 2019 Differences Revenue • Corporate clinics • Franchise fees $12.6 6.9 5.7 $11.2 5.8 5.4 $1.4 1.1 0.3 13% 19% 6% Cost of revenue 1.4 1.3 0.1 5% Sales and marketing 1.8 1.8 0.0 1% Depreciation and amortization 0.7 0.4 0.3 71% G&A 8.5 7.2 1.3 18% Net Income / (Loss) 0.1 0.5 (0.4) (75)% Adj. EBITDA 2 1.1 1.1 0.0 5% 1 Due to rounding, numbers may not add up precisely to the totals. 2 Reconciliation of Adjusted EBITDA to GAAP earnings is included in the Appendix. © 2020 The Joint Corp. All Rights Reserved. $14.6M unrestricted cash at June 30, 2020, compared to $8.5M at December 31, 2019.
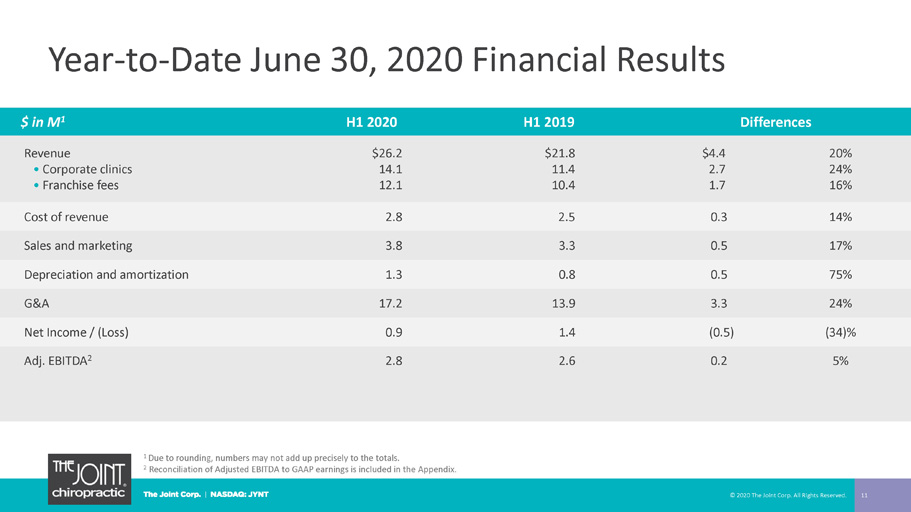
Year - to - Date June 30, 2020 Financial Results 11 $ in M 1 H1 2020 H1 2019 Differences Revenue • Corporate clinics • Franchise fees $26.2 14.1 12.1 $21.8 11.4 10.4 $4.4 2.7 1.7 20% 24% 16% Cost of revenue 2.8 2.5 0.3 14% Sales and marketing 3.8 3.3 0.5 17% Depreciation and amortization 1.3 0.8 0.5 75% G&A 17.2 13.9 3.3 24% Net Income / (Loss) 0.9 1.4 (0.5) (34)% Adj. EBITDA 2 2.8 2.6 0.2 5% 1 Due to rounding, numbers may not add up precisely to the totals. 2 Reconciliation of Adjusted EBITDA to GAAP earnings is included in the Appendix. © 2020 The Joint Corp. All Rights Reserved.
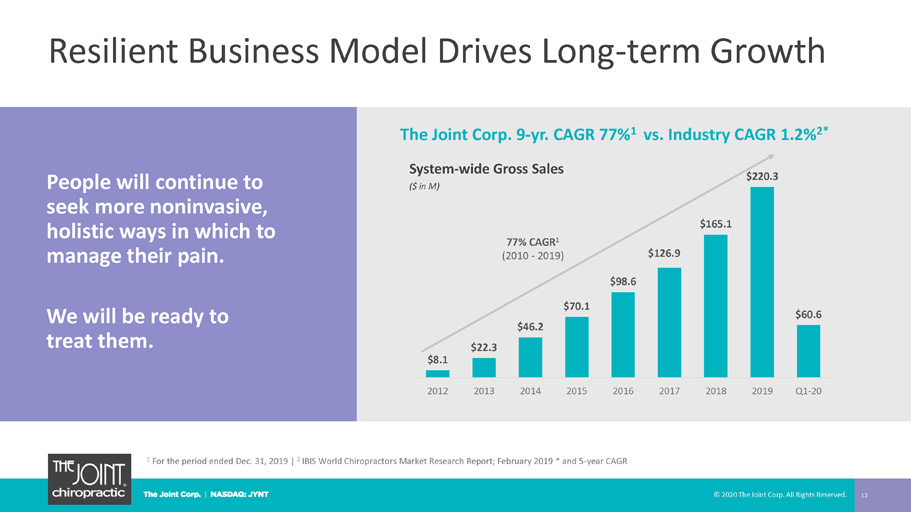
Resilient Business Model Drives Long - term Growth 12 People will continue to seek more noninvasive, holistic ways in which to manage their pain. We will be ready to treat them. System - wide Gross Sales ($ in M) 77% CAGR 1 (2010 - 2019) The Joint Corp. 9 - yr. CAGR 77% 1 vs. Industry CAGR 1.2% 2* 1 For the period ended Dec. 31, 2019 | 2 IBIS World Chiropractors Market Research Report; February 2019 * and 5 - year CAGR © 2020 The Joint Corp. All Rights Reserved. $8.1 $22.3 $46.2 $70.1 $98.6 $126.9 $165.1 $220.3 $60.6 2012 2013 2014 2015 2016 2017 2018 2019 Q1-20
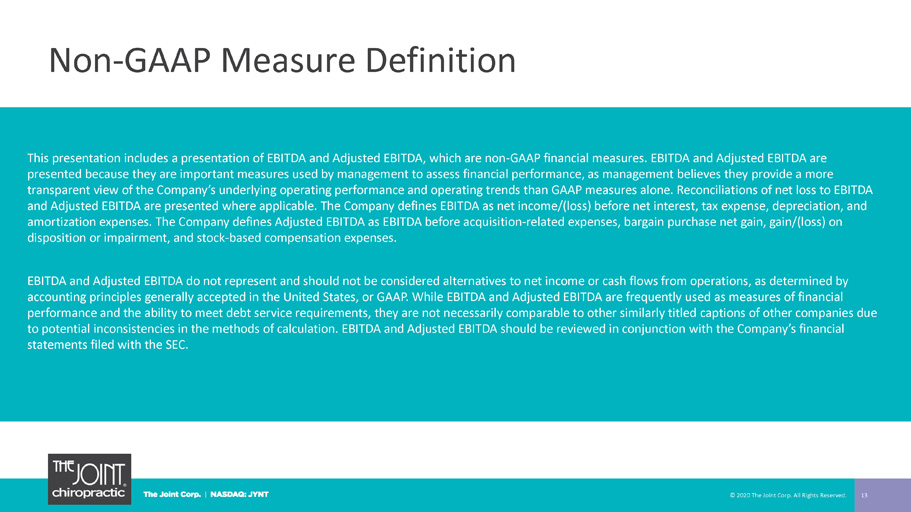
Non - GAAP Measure Definition 13 This presentation includes a presentation of EBITDA and Adjusted EBITDA, which are non - GAAP financial measures. EBITDA and Adjus ted EBITDA are presented because they are important measures used by management to assess financial performance, as management believes they pr ovide a more transparent view of the Company’s underlying operating performance and operating trends than GAAP measures alone. Reconciliat ion s of net loss to EBITDA and Adjusted EBITDA are presented where applicable. The Company defines EBITDA as net income/(loss) before net interest, tax exp ense, depreciation, and amortization expenses. The Company defines Adjusted EBITDA as EBITDA before acquisition - related expenses, bargain purchase net gain, gain/(loss) on disposition or impairment, and stock - based compensation expenses. EBITDA and Adjusted EBITDA do not represent and should not be considered alternatives to net income or cash flows from operat ion s, as determined by accounting principles generally accepted in the United States, or GAAP. While EBITDA and Adjusted EBITDA are frequently used as measures of financial performance and the ability to meet debt service requirements, they are not necessarily comparable to other similarly titled cap tions of other companies due to potential inconsistencies in the methods of calculation. EBITDA and Adjusted EBITDA should be reviewed in conjunction with th e Company’s financial statements filed with the SEC. © 2020 The Joint Corp. All Rights Reserved.
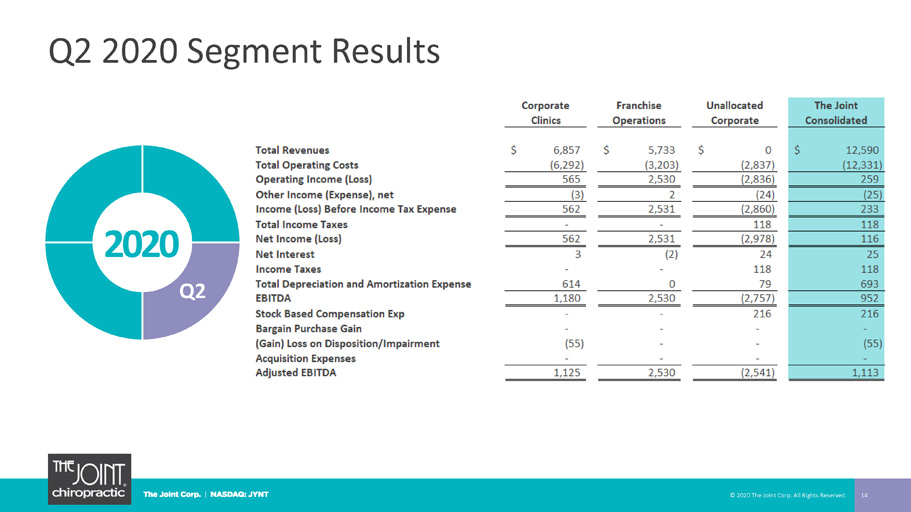
Q2 2020 Segment Results © 2020 The Joint Corp. All Rights Reserved. 14 2020 Q2
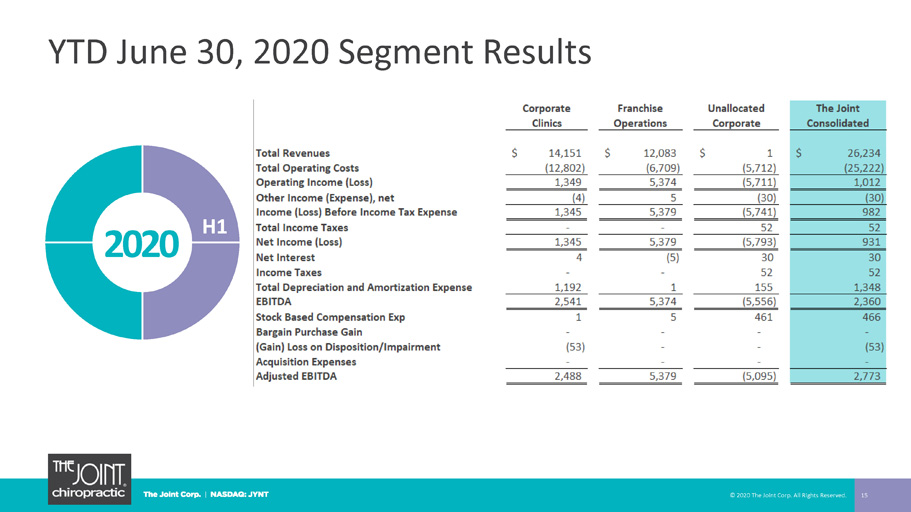
YTD June 30, 2020 Segment Results © 2020 The Joint Corp. All Rights Reserved. 15 2020 H1
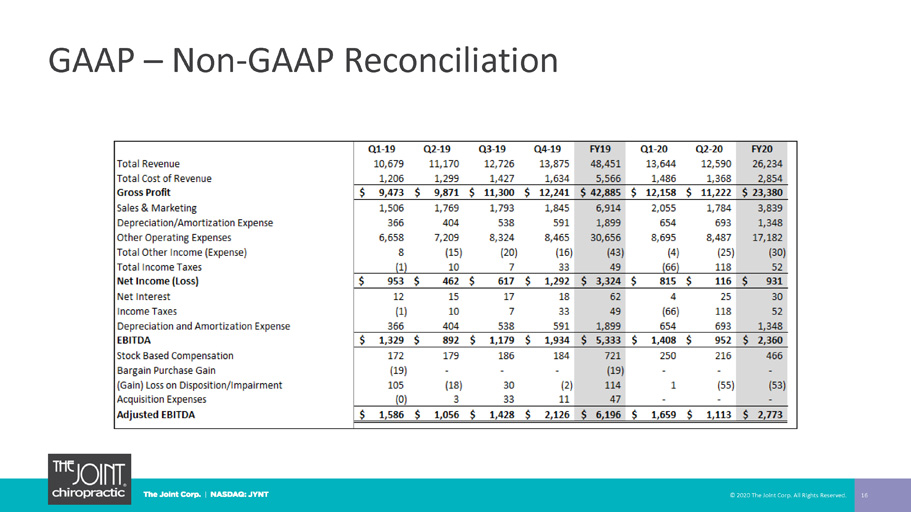
GAAP – Non - GAAP Reconciliation © 2020 The Joint Corp. All Rights Reserved. 16

Jake Singleton, CFO [email protected] The Joint Corp. | 16767 N. Perimeter Dr., Suite 110, Scottsdale, AZ 85260 | (480) 245 - 5960 https://www.facebook.com/thejointchiro @ thejointchiro https://twitter.com/thejointchiro @ thejointchiro https://www.youtube.com/thejointcorp @ thejointcorp Peter D. Holt, President and CEO [email protected] The Joint Corp. | 16767 N. Perimeter Dr., Suite 110, Scottsdale, AZ 85260 | (480) 245 - 5960 Kirsten Chapman, LHA Investor Relations [email protected] LHA Investor Relations | One Market Street, Spear Tower, Suite 3600, San Francisco, CA 94105 | (415) 433 - 3777 17 The Joint Corp. Contact Information © 2020 The Joint Corp. All Rights Reserved.