
EXHIBIT 99.2
© 2020 The Joint Corp. All Rights Reserved. 1 Q1 2020 Financial Results As of March 31, 2020 | Reported On May 7, 2020

Safe Harbor Statement © 2020 The Joint Corp. All Rights Reserved. 2 Certain statements contained in this presentation are "forward - looking statements." We have tried to identify these forward - look ing statements by using words such as "may," "might," " will," "expect,” "anticipate,'' "'believe,“ "could," " intend," "plan," "estimate," "should," "if,“ "project," and similar expressions. All statements other than stateme nts of historical facts contained in this presentation, including statements regarding our growth strategies, our vision, future operations, future financial position, future revenue, projected costs, prospects, plans, obje cti ves of management and expected market growth and potential are forward - looking statements. We have based these forward - looking statements on our current expectations and projections about future events. However, these forw ard - looking statements are subject to risks, uncertainties, assumptions and other factors that may cause our actual results, performance or achievements to be materially different from our expectations and projections. Some of these risks, uncertainties and other factors are set forth in this presentation and in other documents that we file with the United States Securities and Exchange Commission (the “SEC”), including those described in “R isk Factors” in our Annual Report on Form 10 - K for the year ended December 31, 2019 filed with the SEC on or around March 6, 2020, as it may be revised or updated in our subsequent filings. These risk factors include, b ut are not limited to, the continuing impact of the COVID - 19 outbreak on the economy and our operations (including temporary clinic closures, shortened business hours and reduced patient demand) our failure to develop or acquire company - owned or managed clinics as rapidly as we intend, our failure to profitably operate company - owned or managed clinics. Given these risks and uncertainties, readers are cautioned not to place undue reliance on our forward - looking statements. Projections and other forward - looking statements included in this presentation have been prepared based on assumptions, which we believe to be reasonable, but not in accordance with U.S. Generally Accepted Acc oun ting Principals (“GAAP”) or any guidelines of the SEC. Actual results may vary, perhaps materially. You are strongly cautioned not to place undue reliance on such projections and o the r forward - looking statements. All subsequent written and oral forward - looking statements attributable us or to persons acting on our behalf are expressly qualified in their entirety by these cautionary statements. Exc ept as required by federal securities laws, we disclaim any intention or obligation to update or revise any forward - looking statements, whether as a result of new information, future events or otherwise. Any such forward - looking sta tements, whether made in this presentation or elsewhere, should be considered in the context of the various disclosures made by us. Accounting Adjustments Related to the Consolidation of the Operations of the PCs In those states which require a licensed Doctor of Chiropractic to own the entity that offers chiropractic services, the Comp any enters into a management agreement with a professional corporation (PC) licensed in that state to provide chiropractic services. To increase transparency into operating results and to align with accounting rules, the Compan y w ill now consolidate the full operations of the PC. This will result in increases to our revenue and G&A expenses by an identical amount and would have no impact on our bottom line except in instances when the PC has sold trea tme nt packages and wellness plans. Revenue from these packages and plans will now be deferred and will be recognized when patients use their visits. The Company has previously consolidated its clinic operations in Non - PC states such as Arizona and New Mexico, and the deferred revenue around packages and plans in those states was already reflected in its financial statements. Therefore, these adjustments are isolated to the man age d clinics in PC states. These adjustments will have no impact on cash flow. Business Structure The Joint Corp. is a franchisor of clinics and an operator of clinics in certain states. In Arkansas, California, Colorado, D ist rict of Columbia, Florida, Illinois, Kansas, Kentucky, Maryland, Massachusetts, Michigan, Minnesota, New Jersey, New York, North Carolina, Oregon, Pennsylvania, Rhode Island, South Dakota, Tennessee, Washington, West Virginia and Wyo ming, The Joint Corp. and its franchisees provide management services to affiliated professional chiropractic practices.
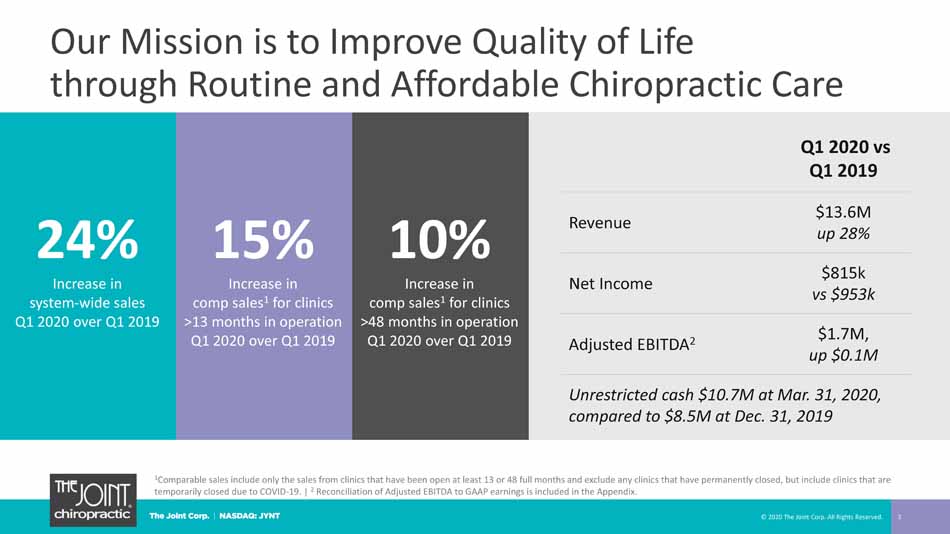
Our Mission is to Improve Quality of Life through Routine and Affordable Chiropractic Care 3 Q1 2020 vs Q1 2019 Revenue $13.6M up 28% Net Income $815k vs $953k Adjusted EBITDA 2 $1.7M, up $0.1M Unrestricted cash $10.7 M at Mar. 31, 2020, compared to $8.5M at Dec. 31, 2019 1 Comparable sales include only the sales from clinics that have been open at least 13 or 48 full months and exclude any clinic s t hat have permanently closed, but include clinics that are temporarily closed due to COVID - 19. | 2 Reconciliation of Adjusted EBITDA to GAAP earnings is included in the Appendix. © 2020 The Joint Corp. All Rights Reserved. 24% Increase in sy stem - wide sales Q1 2020 over Q1 2019 15% Increase in comp sales 1 for clinics >13 months in operation Q1 2020 over Q1 2019 10% Increase in comp sales 1 for clinics >48 months in operation Q1 2020 over Q1 2019
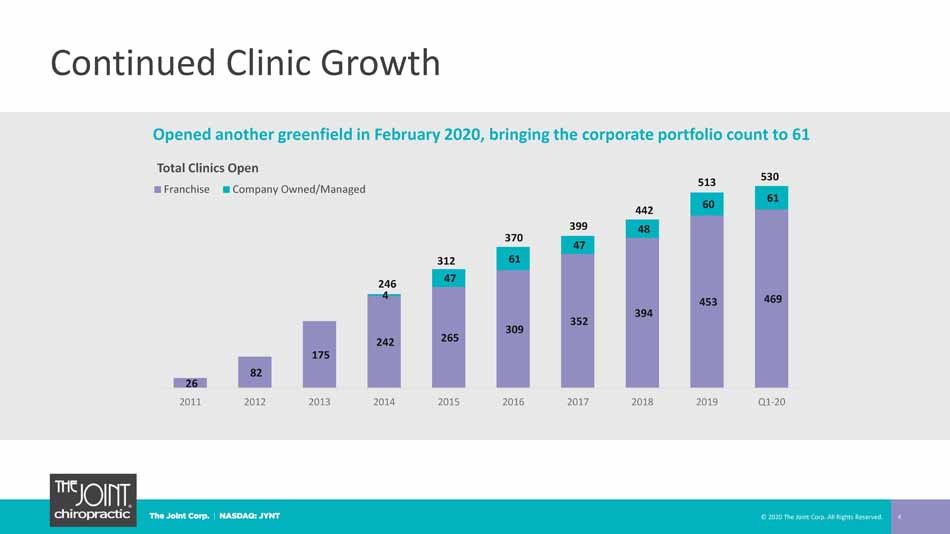
Continued Clinic Growth © 2020 The Joint Corp. All Rights Reserved. 4 26 82 175 242 265 309 352 394 453 469 4 47 61 47 48 60 61 2011 2012 2013 2014 2015 2016 2017 2018 2019 Q1-20 Total Clinics Open Franchise Company Owned/Managed 513 370 399 442 530 312 246 Opened another greenfield in February 2020, bringing the corporate portfolio count to 61
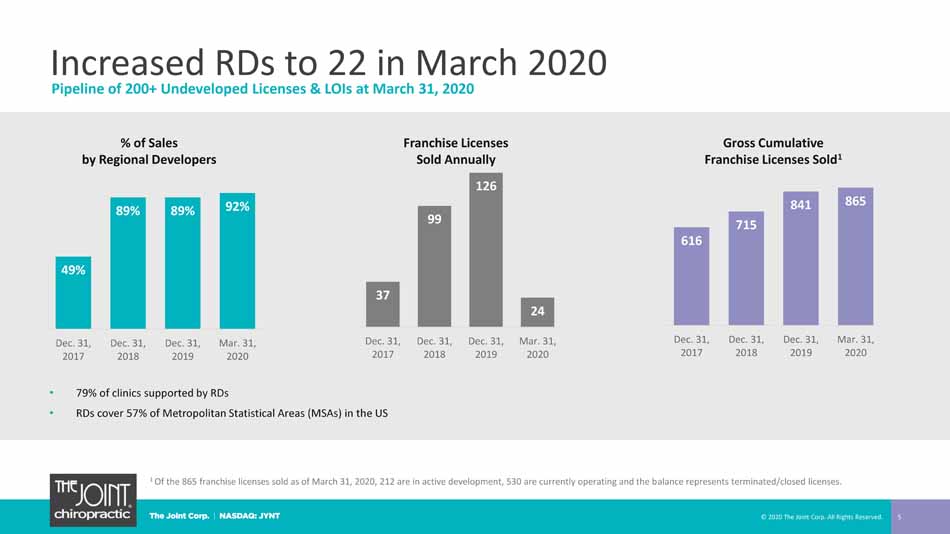
Increased RDs to 22 in March 2020 5 1 Of the 865 franchise licenses sold as of March 31, 2020, 212 are in active development, 530 are currently operating and the b ala nce represents terminated/closed licenses. • 79% of clinics supported by RDs • RDs cover 57% of Metropolitan Statistical Areas (MSAs) in the US Pipeline of 200+ Undeveloped Licenses & LOIs at March 31, 2020 % of Sales by Regional Developers Gross Cumulative Franchise Licenses Sold 1 37 99 126 24 Dec. 31, 2017 Dec. 31, 2018 Dec. 31, 2019 Mar. 31, 2020 Franchise Licenses Sold Annually 616 715 841 865 Dec. 31, 2017 Dec. 31, 2018 Dec. 31, 2019 Mar. 31, 2020 © 2020 The Joint Corp. All Rights Reserved. 49% 89% 89% 92% Dec. 31, 2017 Dec. 31, 2018 Dec. 31, 2019 Mar. 31, 2020
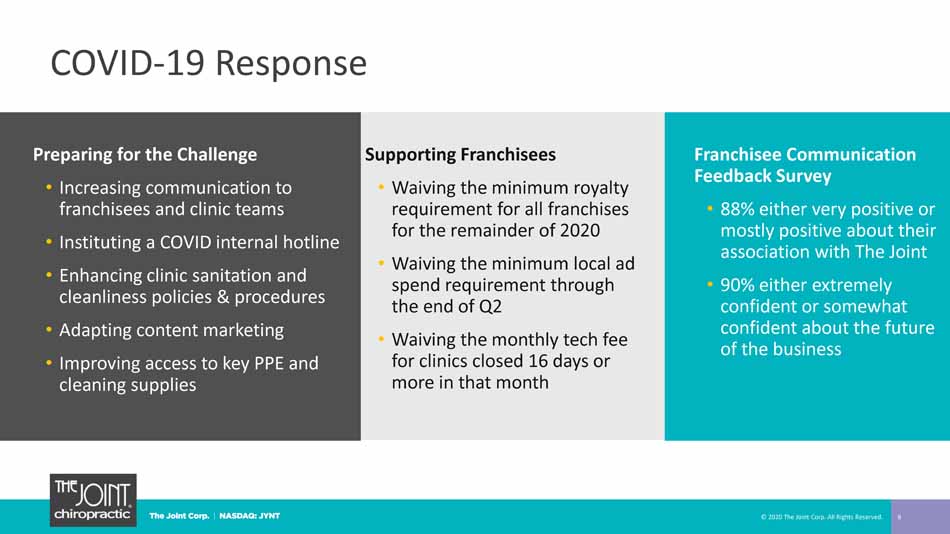
COVID - 19 Response 6 Preparing for the Challenge • Increasing communication to franchisees and clinic teams • Instituting a COVID internal hotline • Enhancing clinic sanitation and cleanliness policies & procedures • Adapting content marketing • Improving access to key PPE and cleaning supplies © 2020 The Joint Corp. All Rights Reserved. Franchisee Communication Feedback Survey • 88% either very positive or mostly positive about their association with The Joint • 90% either extremely confident or somewhat confident about the future of the business Supporting Franchisees • Waiving the minimum r oyalty requirement for all franchises for the remainder of 2020 • Waiving the minimum l ocal ad spend requirement through the end of Q2 • Waiving the monthly tech fee for clinics closed 16 days or more in that month
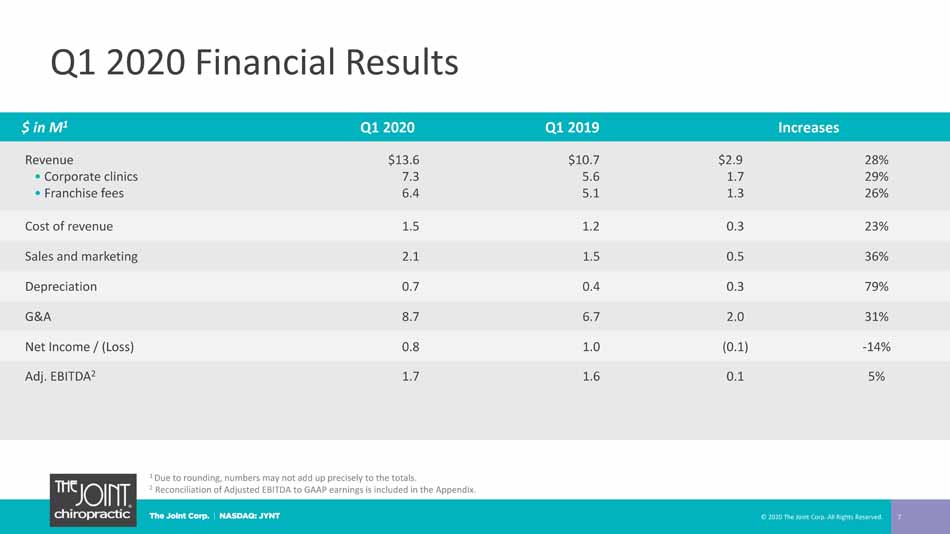
Q1 2020 Financial Results 7 $ in M 1 Q1 2020 Q1 2019 Increases Revenue • Corporate clinics • Franchise fees $13.6 7.3 6.4 $10.7 5.6 5.1 $2.9 1.7 1.3 28% 29% 26% Cost of revenue 1.5 1.2 0.3 23% Sales and marketing 2.1 1.5 0.5 36% Depreciation 0.7 0.4 0.3 79% G&A 8.7 6.7 2.0 31% Net Income / (Loss) 0.8 1.0 (0.1) - 14% Adj. EBITDA 2 1.7 1.6 0.1 5% 1 Due to rounding, numbers may not add up precisely to the totals. 2 Reconciliation of Adjusted EBITDA to GAAP earnings is included in the Appendix. © 2020 The Joint Corp. All Rights Reserved.
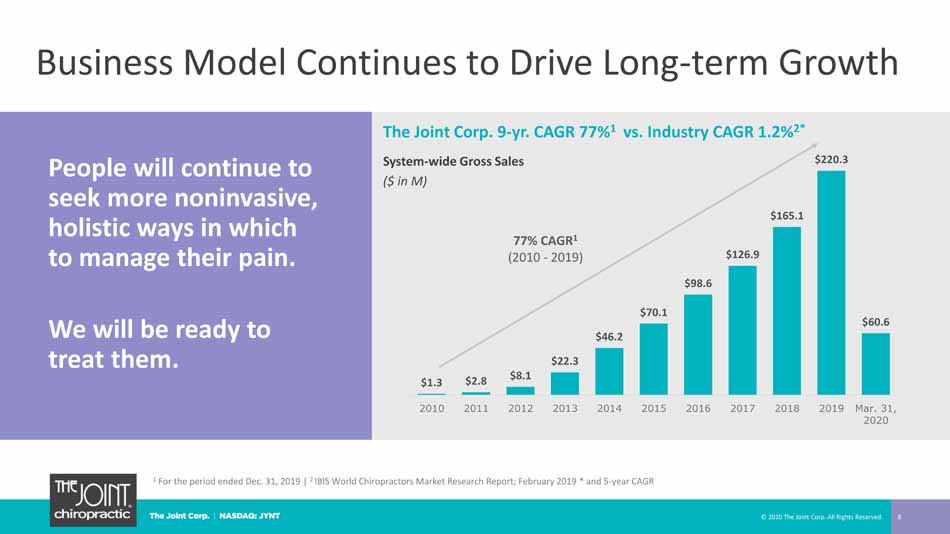
$1.3 $2.8 $8.1 $22.3 $46.2 $70.1 $98.6 $126.9 $165.1 $220.3 $60.6 2010 2011 2012 2013 2014 2015 2016 2017 2018 2019 Mar. 31, 2020 © 2020 The Joint Corp. All Rights Reserved. 8 People will continue to seek more noninvasive, holistic ways in which to manage their pain. We will be ready to treat them. Business Model Continues to Drive Long - term Growth System - wide Gross Sales ($ in M) 77% CAGR 1 (2010 - 2019) The Joint Corp. 9 - yr. CAGR 77% 1 vs. Industry CAGR 1.2% 2* 1 For the period ended Dec. 31, 2019 | 2 IBIS World Chiropractors Market Research Report; February 2019 * and 5 - year CAGR
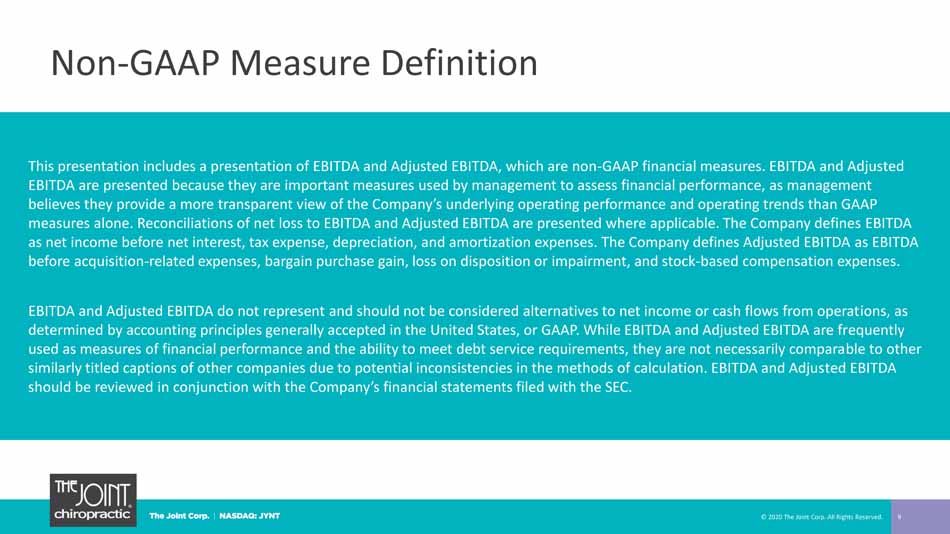
Non - GAAP Measure Definition 9 This presentation includes a presentation of EBITDA and Adjusted EBITDA, which are non - GAAP financial measures. EBITDA and Adjus ted EBITDA are presented because they are important measures used by management to assess financial performance, as management believes they provide a more transparent view of the Company’s underlying operating performance and operating trends than GAAP measures alone. Reconciliations of net loss to EBITDA and Adjusted EBITDA are presented where applicable. The Company defines EB ITDA as net income before net interest, tax expense, depreciation, and amortization expenses. The Company defines Adjusted EBITDA as EBITDA before acquisition - related expenses, bargain purchase gain, loss on disposition or impairment, and stock - based compensation expenses. EBITDA and Adjusted EBITDA do not represent and should not be considered alternatives to net income or cash flows from operat ion s, as determined by accounting principles generally accepted in the United States, or GAAP. While EBITDA and Adjusted EBITDA are fr equ ently used as measures of financial performance and the ability to meet debt service requirements, they are not necessarily compara ble to other similarly titled captions of other companies due to potential inconsistencies in the methods of calculation. EBITDA and Adjus ted EBITDA should be reviewed in conjunction with the Company’s financial statements filed with the SEC. © 2020 The Joint Corp. All Rights Reserved.
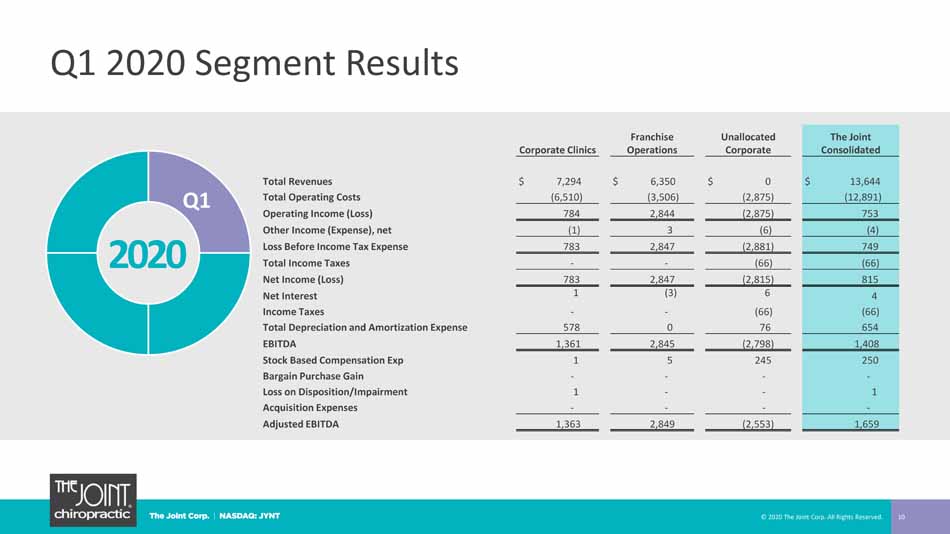
Q1 2020 Segment Results 10 2020 Q1 © 2020 The Joint Corp. All Rights Reserved. Corporate Clinics Franchise Operations Unallocated Corporate The Joint Consolidated Total Revenues $ 7,294 $ 6,350 $ 0 $ 13,644 Total Operating Costs (6,510) (3,506) (2,875) (12,891) Operating Income (Loss) 784 2,844 (2,875) 753 Other Income (Expense), net (1) 3 (6) (4) Loss Before Income Tax Expense 783 2,847 (2,881) 749 Total Income Taxes - - (66) (66) Net Income (Loss) 783 2,847 (2,815) 815 Net Interest 1 (3) 6 4 Income Taxes - - (66) (66) Total Depreciation and Amortization Expense 578 0 76 654 EBITDA 1,361 2,845 (2,798) 1,408 Stock Based Compensation Exp 1 5 245 250 Bargain Purchase Gain - - - - Loss on Disposition/Impairment 1 - - 1 Acquisition Expenses - - - - Adjusted EBITDA 1,363 2,849 (2,553) 1,659
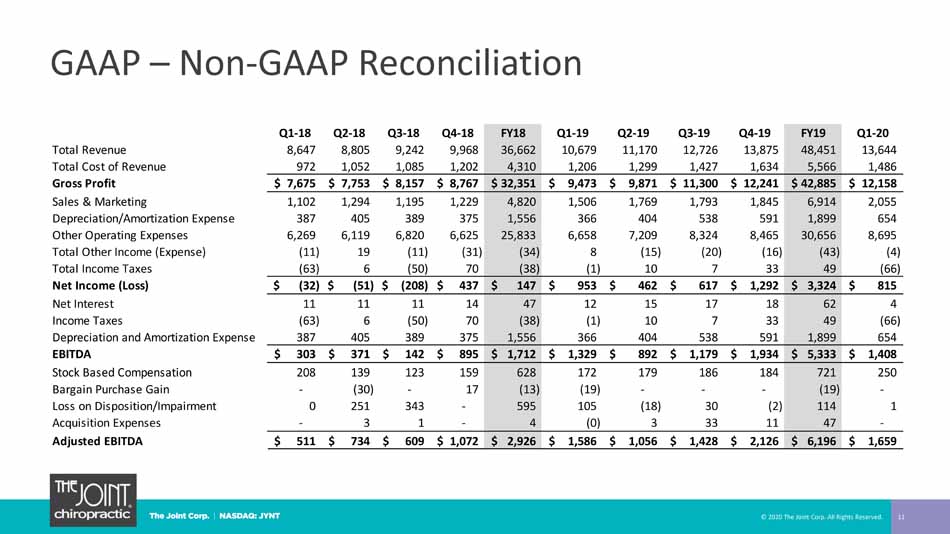
GAAP – Non - GAAP Reconciliation 11 © 2020 The Joint Corp. All Rights Reserved. Q1-18 Q2-18 Q3-18 Q4-18 FY18 Q1-19 Q2-19 Q3-19 Q4-19 FY19 Q1-20 Total Revenue 8,647 8,805 9,242 9,968 36,662 10,679 11,170 12,726 13,875 48,451 13,644 Total Cost of Revenue 972 1,052 1,085 1,202 4,310 1,206 1,299 1,427 1,634 5,566 1,486 Gross Profit 7,675$ 7,753$ 8,157$ 8,767$ 32,351$ 9,473$ 9,871$ 11,300$ 12,241$ 42,885$ 12,158$ Sales & Marketing 1,102 1,294 1,195 1,229 4,820 1,506 1,769 1,793 1,845 6,914 2,055 Depreciation/Amortization Expense 387 405 389 375 1,556 366 404 538 591 1,899 654 Other Operating Expenses 6,269 6,119 6,820 6,625 25,833 6,658 7,209 8,324 8,465 30,656 8,695 Total Other Income (Expense) (11) 19 (11) (31) (34) 8 (15) (20) (16) (43) (4) Total Income Taxes (63) 6 (50) 70 (38) (1) 10 7 33 49 (66) Net Income (Loss) (32)$ (51)$ (208)$ 437$ 147$ 953$ 462$ 617$ 1,292$ 3,324$ 815$ Net Interest 11 11 11 14 47 12 15 17 18 62 4 Income Taxes (63) 6 (50) 70 (38) (1) 10 7 33 49 (66) Depreciation and Amortization Expense 387 405 389 375 1,556 366 404 538 591 1,899 654 EBITDA 303$ 371$ 142$ 895$ 1,712$ 1,329$ 892$ 1,179$ 1,934$ 5,333$ 1,408$ Stock Based Compensation 208 139 123 159 628 172 179 186 184 721 250 Bargain Purchase Gain - (30) - 17 (13) (19) - - - (19) - Loss on Disposition/Impairment 0 251 343 - 595 105 (18) 30 (2) 114 1 Acquisition Expenses - 3 1 - 4 (0) 3 33 11 47 - Adjusted EBITDA 511$ 734$ 609$ 1,072$ 2,926$ 1,586$ 1,056$ 1,428$ 2,126$ 6,196$ 1,659$

Jake Singleton, CFO [email protected] The Joint Corp. | 16767 N. Perimeter Dr., Suite 110, Scottsdale, AZ 85260 | (480) 245 - 5960 https://www.facebook.com/thejointchiro @ thejointchiro https://twitter.com/thejointchiro @ thejointchiro https://www.youtube.com/thejointcorp @ thejointcorp Peter D. Holt, President and CEO [email protected] The Joint Corp. | 16767 N. Perimeter Dr., Suite 110, Scottsdale, AZ 85260 | (480) 245 - 5960 Kirsten Chapman, LHA Investor Relations [email protected] LHA Investor Relations | One Market Street, Spear Tower, Suite 3600, San Francisco, CA 94105 | (415) 433 - 3777 12 The Joint Corp. Contact Information © 2020 The Joint Corp. All Rights Reserved.