
EXHIBIT 99.2
© 2019 The Joint Corp. All Rights Reserved. 1 Q4 2019 Financial Results As of December 31, 2019 | Reported On March 5, 2020
Safe Harbor Statement © 2020 The Joint Corp. All Rights Reserved. 2 Certain statements contained in this presentation are "forward - looking statements." We have tried to identify these forward - look ing statements by using words such as "may," "might," " will," "expect,” "anticipate,'' "'believe,“ "could," " intend," "plan," "estimate," "should," "if,“ "project," and similar expressions. All statements other than stateme nts of historical facts contained in this presentation, including statements regarding our growth strategies, our vision, future operations, future financial position, future revenue, projected costs, prospects, plans, obje cti ves of management and expected market growth and potential are forward - looking statements. We have based these forward - looking statements on our current expectations and projections about future events. However, these forw ard - looking statements are subject to risks, uncertainties, assumptions and other factors that may cause our actual results, performance or achievements to be materially different from our expectations and projections. Some of these risks, uncertainties and other factors are set forth in this presentation and in other documents that we file with the United States Securities and Exchange Commission (the “SEC”), including those described in “R isk Factors” in our Annual Report on Form 10 - K as filed with the SEC for the year ended December 31, 2018, as updated for any material changes described in any subsequently - filed Quarterly Reports on Form 10 - Q, and in our Ann ual Report on Form 10 - K for the year ended December 31, 2019 expected to be filed with the SEC on or around March 6, 2020, as they may be revised or updated in our subsequent filings. These risk factors include, but ar e not limited to, our failure to develop or acquire company - owned or managed clinics as rapidly as we intend, our failure to profitably operate company - owned or managed clinics, and uncertainties associated with the coronavirus (including its possible effects on patient demand). Given these risks and uncertainties, readers are cautioned not to place undue reliance on our forward - looking statements. Projections and other forward - looking statements in cluded in this presentation have been prepared based on assumptions, which we believe to be reasonable, but not in accordance with U.S. Generally Accepted Accounting Principals (“GAAP”) or any guidelines of the SEC. A ctu al results may vary, perhaps materially. You are strongly cautioned not to place undue reliance on such projections and other forward - looking statements. All subsequent written and oral forward - looking statements attributabl e us or to persons acting on our behalf are expressly qualified in their entirety by these cautionary statements. Except as required by federal securities laws, we disclaim any intention or obligation to update or re vis e any forward - looking statements, whether as a result of new information, future events or otherwise. Any such forward - looking statements, whether made in this presentation or elsewhere, should be considered in the cont ext of the various disclosures made by us. Accounting Adjustments Related to the Consolidation of the Operations of the PCs In those states which require a licensed Doctor of Chiropractic to own the entity that offers chiropractic services, the Comp any enters into a management agreement with a professional corporation (PC) licensed in that state to provide chiropractic services. To increase transparency into operating results and to align with accounting rules, the Compan y w ill now consolidate the full operations of the PC. This will result in increases to our revenue and G&A expenses by an identical amount and would have no impact on our bottom line except in instances when the PC has sold trea tme nt packages and wellness plans. Revenue from these packages and plans will now be deferred and will be recognized when patients use their visits. The Company has previously consolidated its clinic operations in Non - PC states such as Arizona and New Mexico, and the deferred revenue around packages and plans in those states was already reflected in its financial statements. Therefore, these adjustments are isolated to the man age d clinics in PC states. These adjustments will have no impact on cash flow. Business Structure The Joint Corp. is a franchisor of clinics and an operator of clinics in certain states. In Arkansas, California, Colorado, D ist rict of Columbia, Florida, Illinois, Kansas, Kentucky, Maryland, Massachusetts, Michigan, Minnesota, New Jersey, New York, North Carolina, Oregon, Pennsylvania, Rhode Island, South Dakota, Tennessee, Washington, West Virginia and Wyo ming, The Joint Corp. and its franchisees provide management services to affiliated professional chiropractic practices.
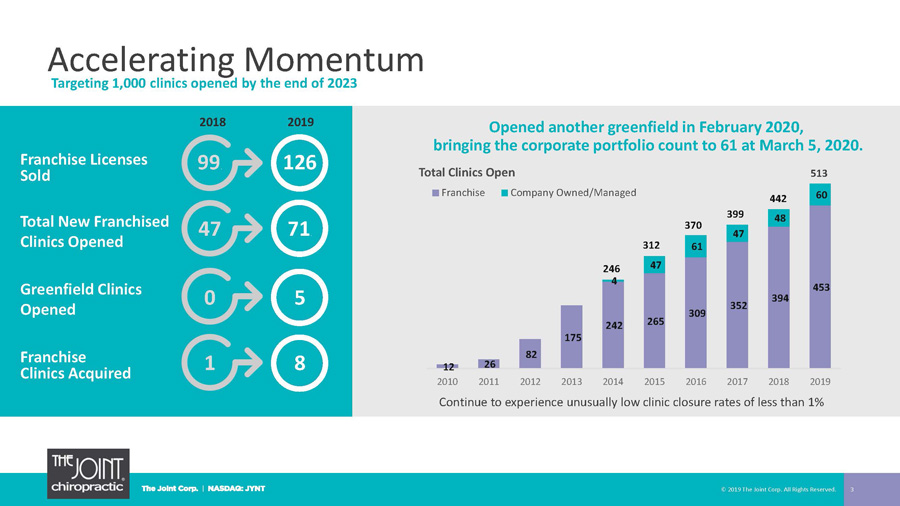
Accelerating Momentum 12 26 82 175 242 265 309 352 394 453 4 47 61 47 48 60 2010 2011 2012 2013 2014 2015 2016 2017 2018 2019 Total Clinics Open Franchise Company Owned/Managed © 2019 The Joint Corp. All Rights Reserved. 3 0 5 Franchise Licenses Sold Total New Franchised Clinics Opened Greenfield Clinics Opened Franchise Clinics Acquired 2018 2019 99 . 126 47 71 . 1 8 Continue to experience unusually low clinic closure rates of less than 1% 370 399 442 513 312 246 Opened another greenfield in February 2020, bringing the corporate portfolio count to 61 at March 5, 2020. Targeting 1,000 clinics opened by the end of 2023
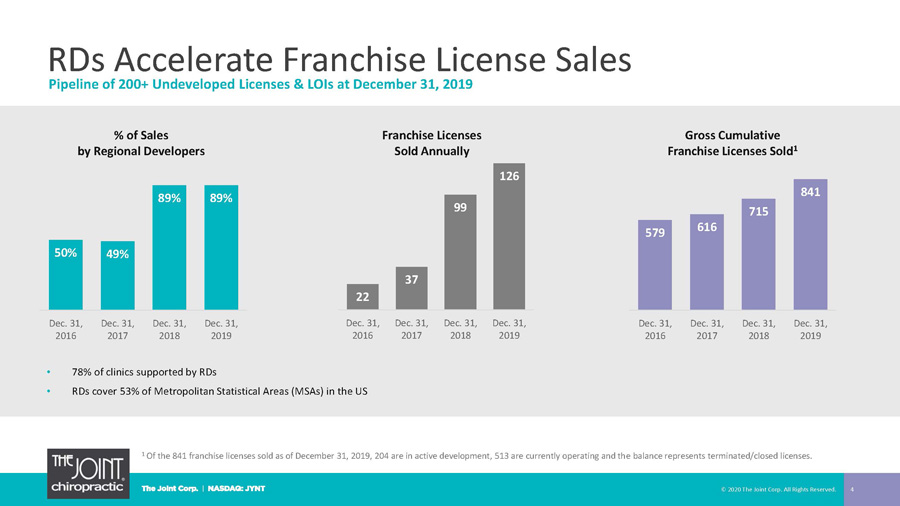
RDs Accelerate Franchise License Sales 4 1 Of the 841 franchise licenses sold as of December 31, 2019, 204 are in active development, 513 are currently operating and th e b alance represents terminated/closed licenses. • 78% of clinics supported by RDs • RDs cover 53% of Metropolitan Statistical Areas (MSAs) in the US Pipeline of 200+ Undeveloped Licenses & LOIs at December 31, 2019 50% 49% 89% 89% Dec. 31, 2016 Dec. 31, 2017 Dec. 31, 2018 Dec. 31, 2019 % of Sales by Regional Developers Gross Cumulative Franchise Licenses Sold 1 22 37 99 126 Dec. 31, 2016 Dec. 31, 2017 Dec. 31, 2018 Dec. 31, 2019 Franchise Licenses Sold Annually 579 616 715 841 Dec. 31, 2016 Dec. 31, 2017 Dec. 31, 2018 Dec. 31, 2019 © 2020 The Joint Corp. All Rights Reserved.
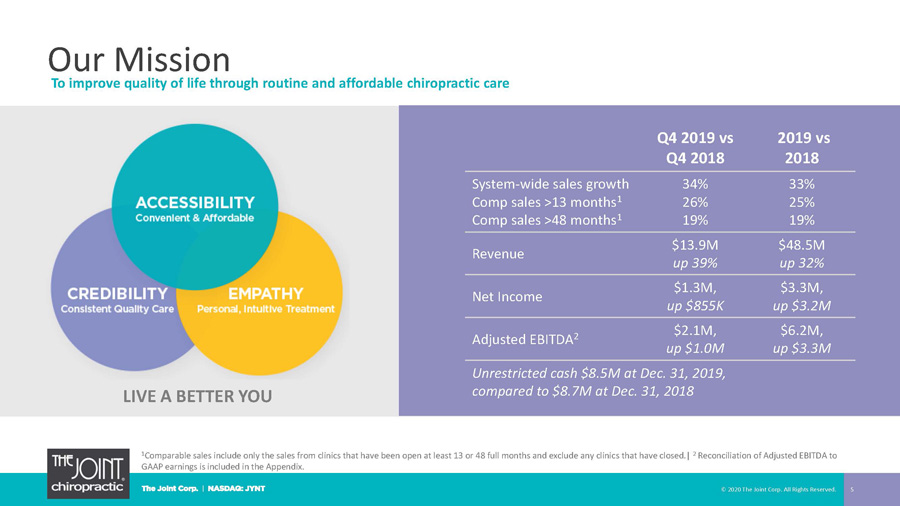
Our Mission 5 To improve quality of life through routine and affordable chiropractic care Q4 2019 vs Q4 2018 2019 vs 2018 System - wide sales growth Comp sales >13 months 1 Comp sales >48 months 1 34% 26% 19% 33% 25% 19% Revenue $13.9M up 39% $48.5M up 32% Net Income $1.3M, up $855K $3.3M, up $3.2M Adjusted EBITDA 2 $2.1M, up $1.0M $6.2M, up $3.3M Unrestricted cash $8.5 M at Dec. 31, 2019, compared to $8.7M at Dec. 31, 2018 LIVE A BETTER YOU 1 Comparable sales include only the sales from clinics that have been open at least 13 or 48 full months and exclude any clinic s t hat have closed.| 2 Reconciliation of Adjusted EBITDA to GAAP earnings is included in the Appendix. © 2020 The Joint Corp. All Rights Reserved.
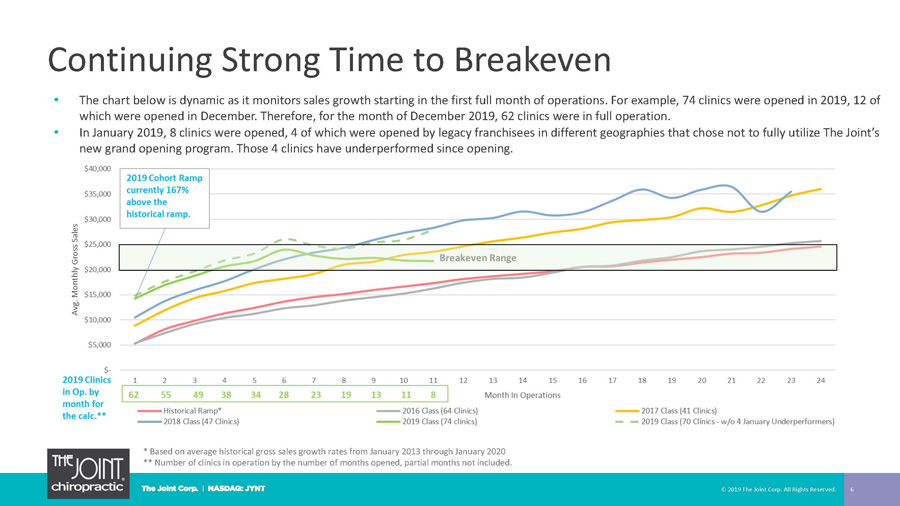
Continuing Strong Time to Breakeven © 2019 The Joint Corp. All Rights Reserved. 6 * Based on average historical gross sales growth rates from January 2013 through January 2020 ** Number of clinics in operation by the number of months opened, partial months not included. 62 55 49 38 34 28 23 19 13 11 8 • The chart below is dynamic as it monitors sales growth starting in the first full month of operations. For example, 74 clinic s w ere opened in 2019, 12 of which were opened in December. Therefore, for the month of December 2019, 62 clinics were in full operation. • In January 2019, 8 clinics were opened, 4 of which were opened by legacy franchisees in different geographies that chose not to fully utilize The Joint’s new grand opening program. Those 4 clinics have underperformed since opening.
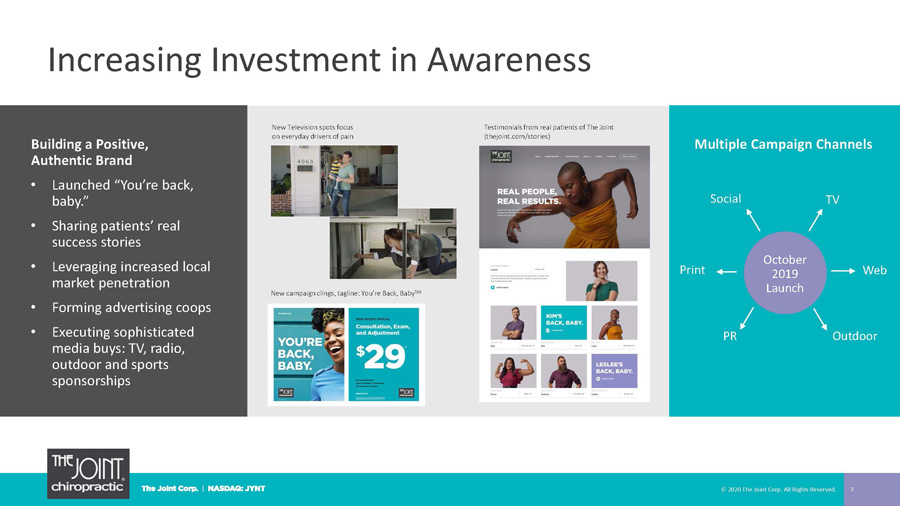
Increasing Investment in Awareness 7 Multiple Campaign Channels Building a Positive, Authentic Brand • Launched “You’re back, baby.” • Sharing patients’ real success stories • Leveraging increased local market penetration • Forming advertising coops • Executing sophisticated media buys: TV, radio, outdoor and sports sponsorships PR Web Outdoor Print Social October 2019 Launch TV New Television s pots focus on everyday drivers of pain Testimonials from real patients of The Joint (thejoint.com/stories) New campaign clings, tagline: You’re Back, Baby SM © 2020 The Joint Corp. All Rights Reserved.
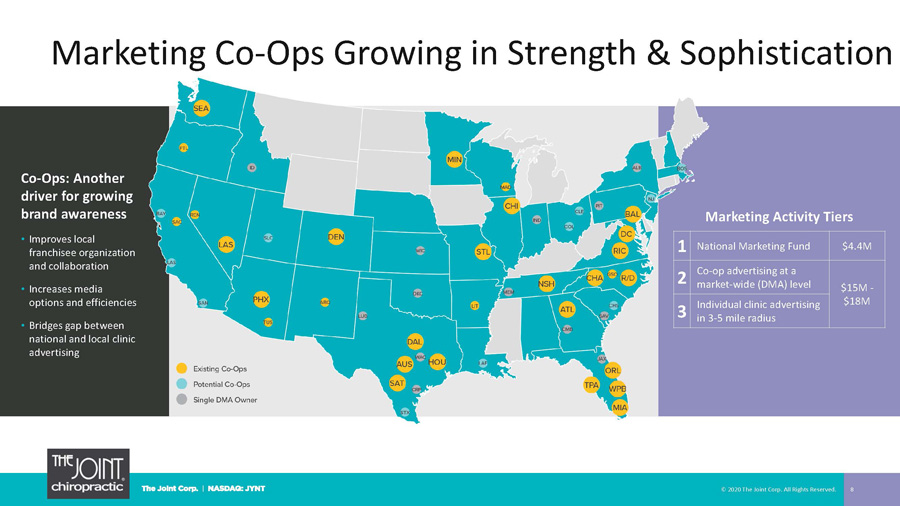
Marketing Co - Ops Growing in Strength & Sophistication 8 Co - Ops: Another driver for growing brand awareness • Improves local franchisee organization and collaboration • Increases media options and efficiencies • Bridges gap between national and local clinic advertising © 2020 The Joint Corp. All Rights Reserved. Marketing Activity Tiers 1 National Marketing Fund $4.4M 2 Co - op advertising at a market - wide (DMA) level $15M - $18M 3 Individual clinic advertising in 3 - 5 mile radius
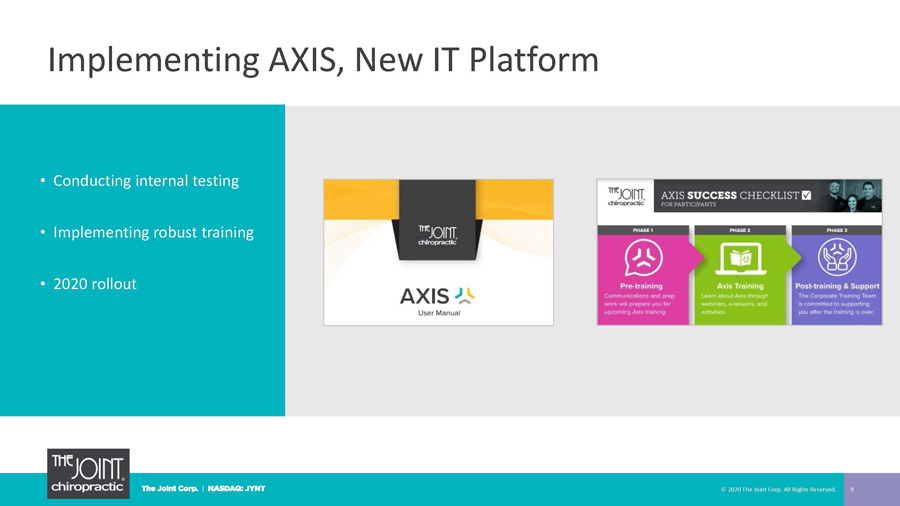
Implementing AXIS, New IT Platform 9 • Conducting internal testing • Implementing robust training • 2020 rollout © 2020 The Joint Corp. All Rights Reserved.
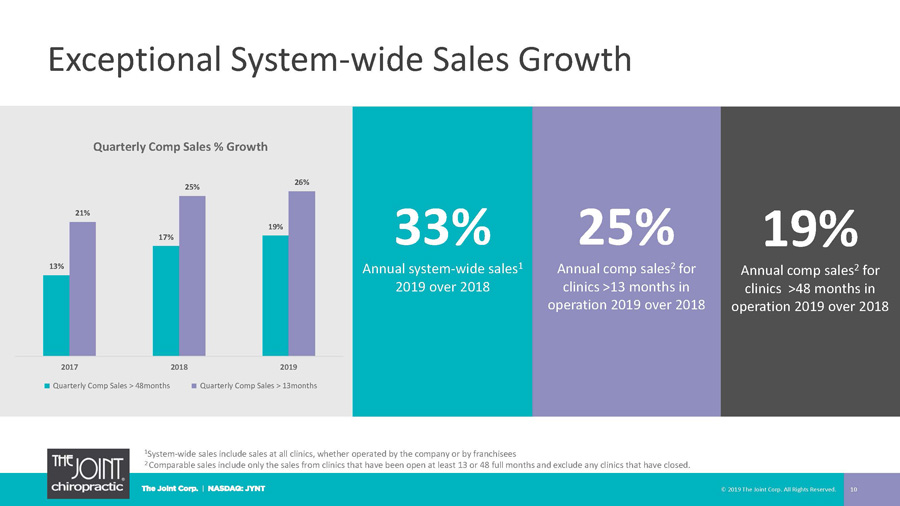
Exceptional System - wide Sales Growth © 2019 The Joint Corp. All Rights Reserved. 10 33% Annual system - wide sales 1 2019 over 2018 25% Annual comp sales 2 for clinics >13 months in operation 2019 over 2018 19% Annual comp sales 2 for clinics >48 months in operation 2019 over 2018 1 System - wide sales include sales at all clinics, whether operated by the company or by franchisees 2 Comparable sales include only the sales from clinics that have been open at least 13 or 48 full months and exclude any clinic s t hat have closed. 13% 17% 19% 21% 25% 26% 2017 2018 2019 Quarterly Comp Sales % Growth Quarterly Comp Sales > 48months Quarterly Comp Sales > 13months
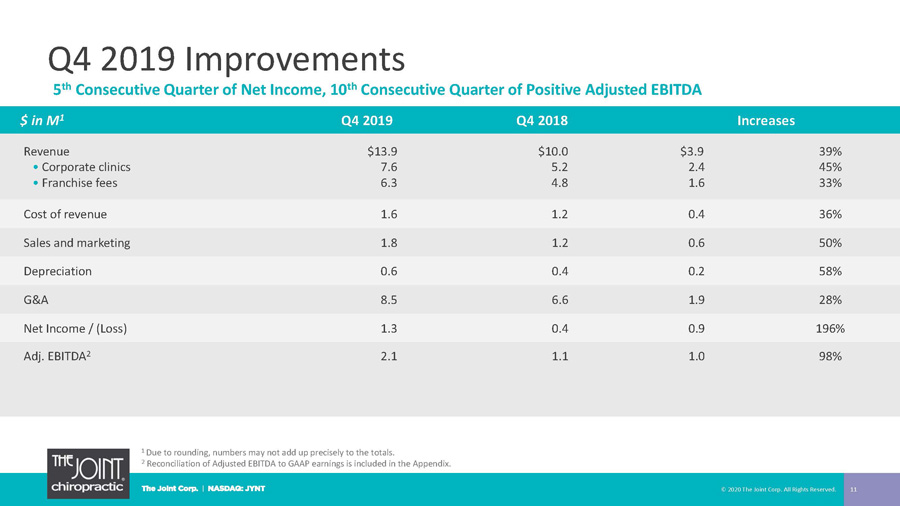
Q4 2019 Improvements 11 5 th Consecutive Quarter of Net Income, 10 th Consecutive Quarter of Positive Adjusted EBITDA $ in M 1 Q4 2019 Q4 2018 Increases Revenue • Corporate clinics • Franchise fees $13.9 7.6 6.3 $10.0 5.2 4.8 $3.9 2.4 1.6 39% 45% 33% Cost of revenue 1.6 1.2 0.4 36% Sales and marketing 1.8 1.2 0.6 50% Depreciation 0.6 0.4 0.2 58% G&A 8.5 6.6 1.9 28% Net Income / (Loss) 1.3 0.4 0.9 196% Adj. EBITDA 2 2.1 1.1 1.0 98% 1 Due to rounding, numbers may not add up precisely to the totals. 2 Reconciliation of Adjusted EBITDA to GAAP earnings is included in the Appendix. © 2020 The Joint Corp. All Rights Reserved.
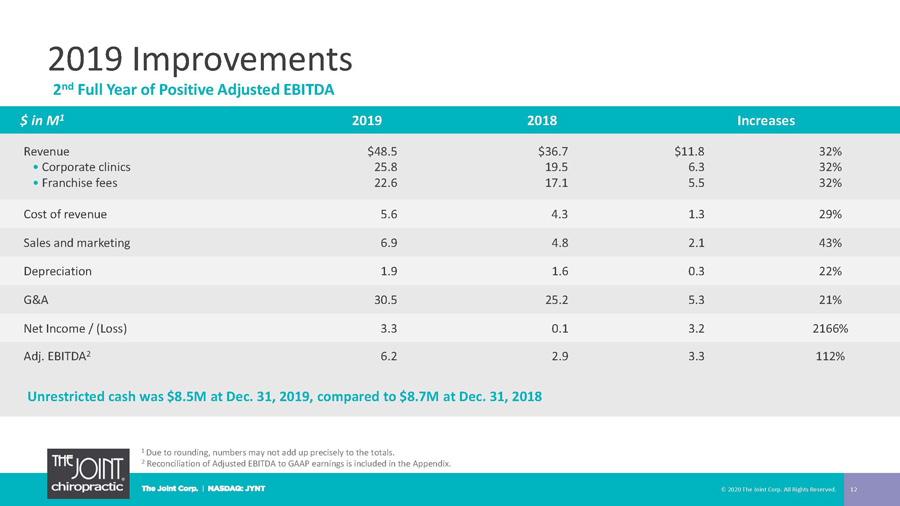
2019 Improvements 12 2 nd Full Year of Positive Adjusted EBITDA $ in M 1 2019 2018 Increases Revenue • Corporate clinics • Franchise fees $48.5 25.8 22.6 $36.7 19.5 17.1 $11.8 6.3 5.5 32% 32% 32% Cost of revenue 5.6 4.3 1.3 29% Sales and marketing 6.9 4.8 2.1 43% Depreciation 1.9 1.6 0.3 22% G&A 30.5 25.2 5.3 21% Net Income / (Loss) 3.3 0.1 3.2 2166% Adj. EBITDA 2 6.2 2.9 3.3 112% Unrestricted cash was $8.5M at Dec. 31, 2019, compared to $8.7M at Dec. 31, 2018 © 2020 The Joint Corp. All Rights Reserved. 1 Due to rounding, numbers may not add up precisely to the totals. 2 Reconciliation of Adjusted EBITDA to GAAP earnings is included in the Appendix.
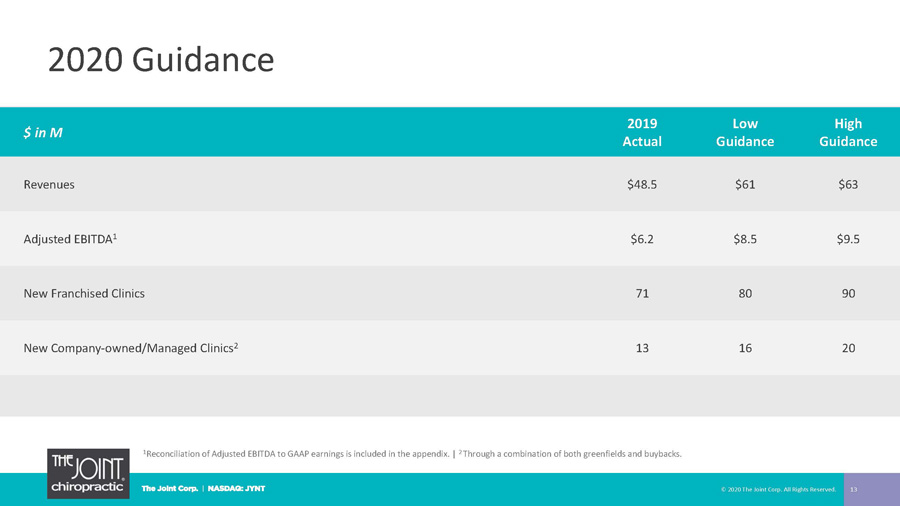
2020 Guidance 13 1 Reconciliation of Adjusted EBITDA to GAAP earnings is included in the appendix. | 2 Through a combination of both greenfields and buybacks. $ in M 2019 Actual Low Guidance High Guidance Revenues $48.5 $61 $63 Adjusted EBITDA 1 $6.2 $8.5 $9.5 New Franchised Clinics 71 80 90 New Company - owned/Managed Clinics 2 13 16 20 © 2020 The Joint Corp. All Rights Reserved.
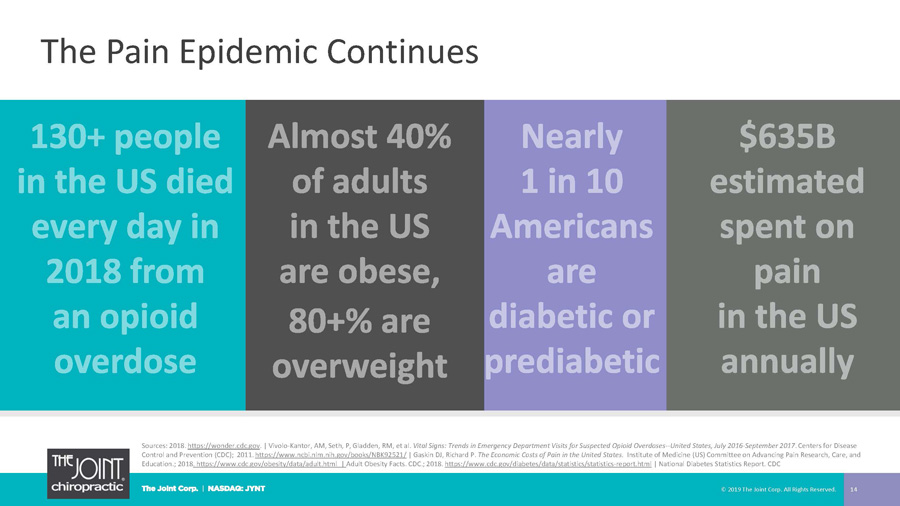
The Pain Epidemic Continues © 2019 The Joint Corp. All Rights Reserved. 14 Sources: 2018. https://wonder.cdc.gov . | Vivolo - Kantor, AM, Seth, P, Gladden, RM, et al. Vital Signs: Trends in Emergency Department Visits for Suspected Opioid Overdoses -- United States, July 2016 - September 2017 . Centers for Disease Control and Prevention (CDC); 2011. https://www.ncbi.nlm.nih.gov/books/NBK92521/ | Gaskin DJ, Richard P. The Economic Costs of Pain in the United States . Institute of Medicine (US) Committee on Advancing Pain Research, Care, and Education.; 2018 . https://www.cdc.gov/obesity/data/adult.html | Adult Obesity Facts. CDC.; 2018. https://www.cdc.gov/diabetes/data/statistics/statistics - report.html | National Diabetes Statistics Report. CDC
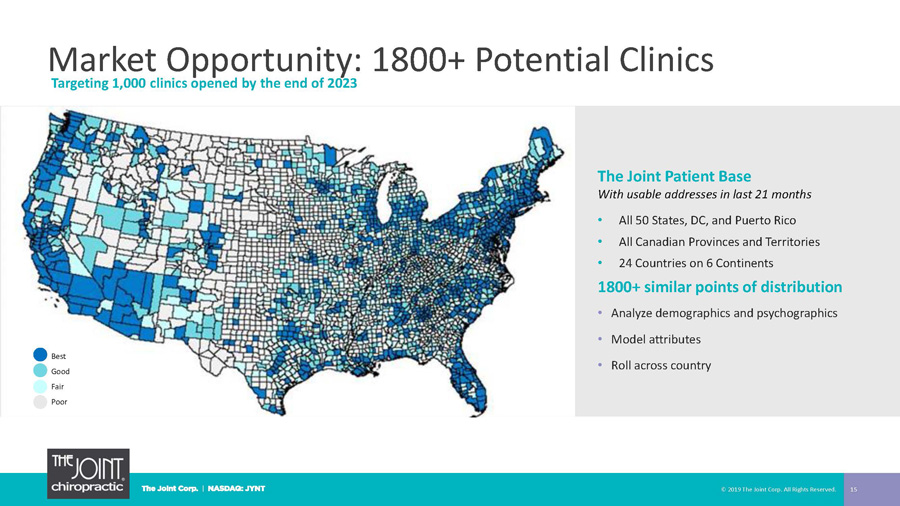
Market Opportunity: 1800+ Potential Clinics © 2019 The Joint Corp. All Rights Reserved. 15 The Joint Patient Base With usable addresses in last 21 months • All 50 States, DC, and Puerto Rico • All Canadian Provinces and Territories • 24 Countries on 6 Continents 1800+ similar points of distribution • Analyze demographics and psychographics • Model attributes • Roll across country Targeting 1,000 clinics opened by the end of 2023 Best Good Fair Poor
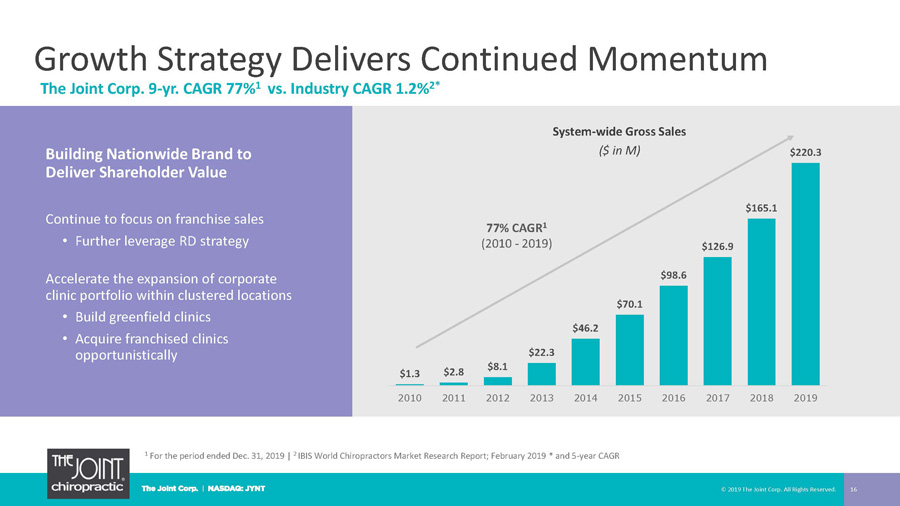
$1.3 $2.8 $8.1 $22.3 $46.2 $70.1 $98.6 $126.9 $165.1 $220.3 2010 2011 2012 2013 2014 2015 2016 2017 2018 2019 © 2019 The Joint Corp. All Rights Reserved. 16 Building Nationwide Brand to Deliver Shareholder Value Continue to focus on franchise sales • Further leverage RD strategy Accelerate the expansion of corporate clinic portfolio within clustered locations • Build greenfield clinics • Acquire franchised clinics opportunistically Growth Strategy Delivers Continued Momentum System - wide Gross Sales ($ in M) 77% CAGR 1 (2010 - 2019) The Joint Corp. 9 - yr. CAGR 77% 1 vs. Industry CAGR 1.2% 2* 1 For the period ended Dec. 31, 2019 | 2 IBIS World Chiropractors Market Research Report; February 2019 * and 5 - year CAGR
Non - GAAP Measure Definition 17 This presentation includes a presentation of EBITDA and Adjusted EBITDA, which are non - GAAP financial measures. EBITDA and Adjus ted EBITDA are presented because they are important measures used by management to assess financial performance, as management believes they provide a more transparent view of the Company’s underlying operating performance and operating than GAAP measures alone. Reconciliations of net loss to EBITDA and Adjusted EBITDA are presented where applicable. The Company defines EBITDA a s n et income before net interest, tax expense, depreciation, and amortization expenses. The Company defines Adjusted EBITDA as EBIT DA before acquisition - related expenses, bargain purchase gain, loss on disposition or impairment, and stock - based compensation expenses. EBITDA and Adjusted EBITDA do not represent and should not be considered alternatives to net income or cash flows from operat ion s, as determined by accounting principles generally accepted in the United States, or GAAP. While EBITDA and Adjusted EBITDA are fr equ ently used as measures of financial performance and the ability to meet debt service requirements, they are not necessarily compara ble to other similarly titled captions of other companies due to potential inconsistencies in the methods of calculation. EBITDA and Adjus ted EBITDA should be reviewed in conjunction with the Company’s financial statements filed with the SEC. © 2020 The Joint Corp. All Rights Reserved.
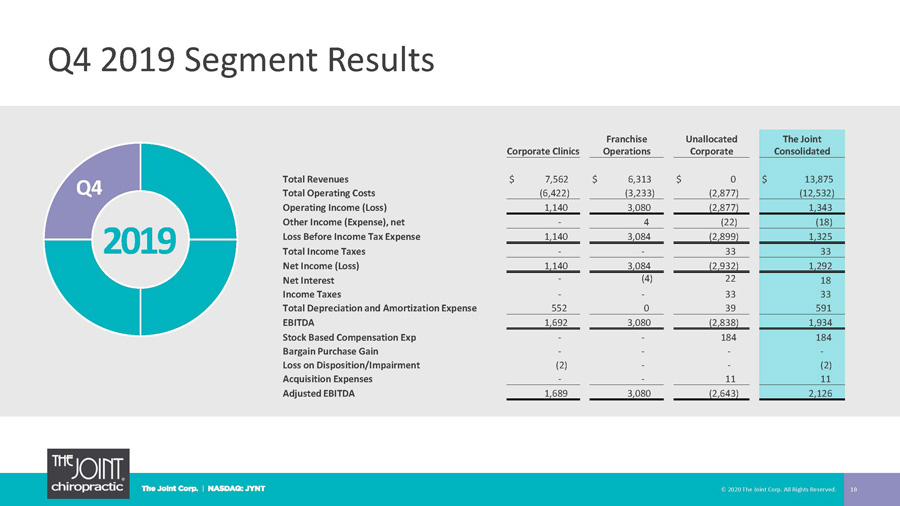
Q4 2019 Segment Results 18 2019 Q4 © 2020 The Joint Corp. All Rights Reserved. Corporate Clinics Franchise Operations Unallocated Corporate The Joint Consolidated Total Revenues $ 7,562 $ 6,313 $ 0 $ 13,875 Total Operating Costs (6,422) (3,233) (2,877) (12,532) Operating Income (Loss) 1,140 3,080 (2,877) 1,343 Other Income (Expense), net - 4 (22) (18) Loss Before Income Tax Expense 1,140 3,084 (2,899) 1,325 Total Income Taxes - - 33 33 Net Income (Loss) 1,140 3,084 (2,932) 1,292 Net Interest - (4) 22 18 Income Taxes - - 33 33 Total Depreciation and Amortization Expense 552 0 39 591 EBITDA 1,692 3,080 (2,838) 1,934 Stock Based Compensation Exp - - 184 184 Bargain Purchase Gain - - - - Loss on Disposition/Impairment (2) - - (2) Acquisition Expenses - - 11 11 Adjusted EBITDA 1,689 3,080 (2,643) 2,126
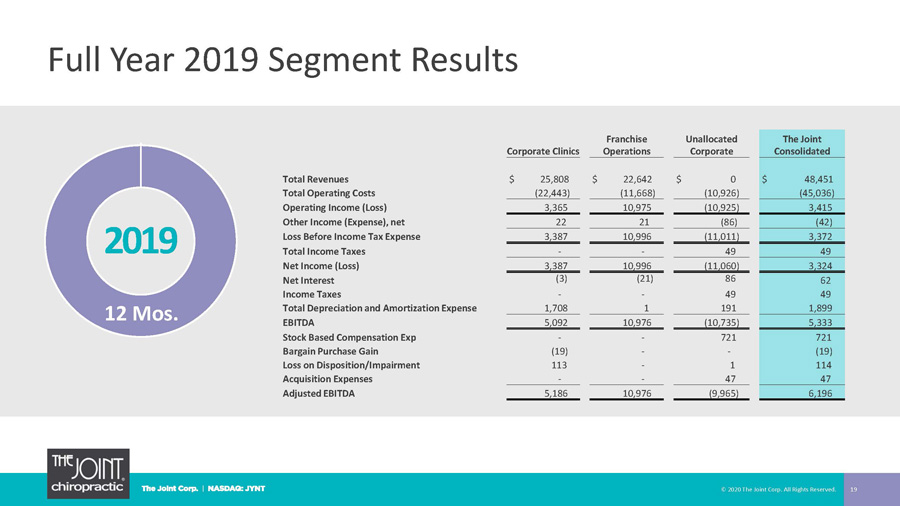
Full Year 2019 Segment Results 19 2019 12 Mos. © 2020 The Joint Corp. All Rights Reserved. Corporate Clinics Franchise Operations Unallocated Corporate The Joint Consolidated Total Revenues $ 25,808 $ 22,642 $ 0 $ 48,451 Total Operating Costs (22,443) (11,668) (10,926) (45,036) Operating Income (Loss) 3,365 10,975 (10,925) 3,415 Other Income (Expense), net 22 21 (86) (42) Loss Before Income Tax Expense 3,387 10,996 (11,011) 3,372 Total Income Taxes - - 49 49 Net Income (Loss) 3,387 10,996 (11,060) 3,324 Net Interest (3) (21) 86 62 Income Taxes - - 49 49 Total Depreciation and Amortization Expense 1,708 1 191 1,899 EBITDA 5,092 10,976 (10,735) 5,333 Stock Based Compensation Exp - - 721 721 Bargain Purchase Gain (19) - - (19) Loss on Disposition/Impairment 113 - 1 114 Acquisition Expenses - - 47 47 Adjusted EBITDA 5,186 10,976 (9,965) 6,196
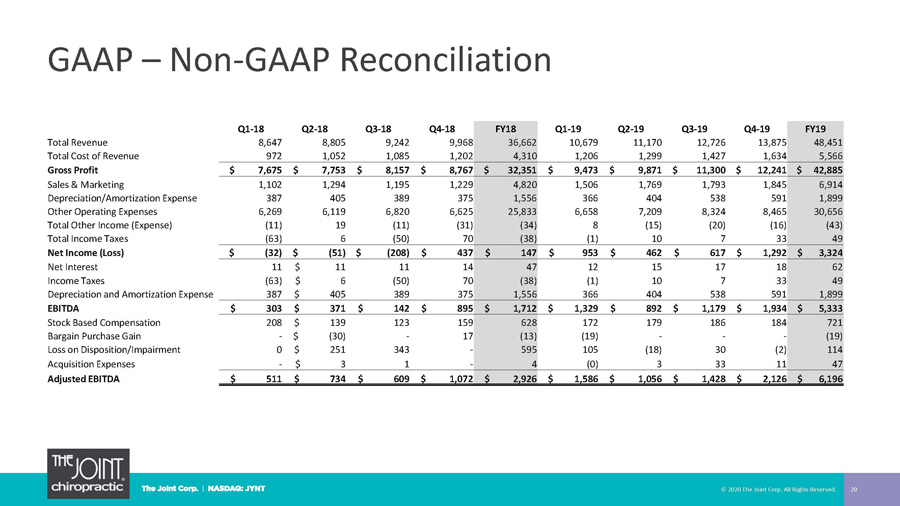
GAAP – Non - GAAP Reconciliation 20 © 2020 The Joint Corp. All Rights Reserved. Q1 - 18 Q2 - 18 Q3 - 18 Q4 - 18 FY18 Q1 - 19 Q2 - 19 Q3 - 19 Q4 - 19 FY19 Total Revenue 8,647 8,805 9,242 9,968 36,662 10,679 11,170 12,726 13,875 48,451 Total Cost of Revenue 972 1,052 1,085 1,202 4,310 1,206 1,299 1,427 1,634 5,566 Gross Profit $ 7,675 $ 7,753 $ 8,157 $ 8,767 $ 32,351 $ 9,473 $ 9,871 $ 11,300 $ 12,241 $ 42,885 Sales & Marketing 1,102 1,294 1,195 1,229 4,820 1,506 1,769 1,793 1,845 6,914 Depreciation/Amortization Expense 387 405 389 375 1,556 366 404 538 591 1,899 Other Operating Expenses 6,269 6,119 6,820 6,625 25,833 6,658 7,209 8,324 8,465 30,656 Total Other Income (Expense) (11) 19 (11) (31) (34) 8 (15) (20) (16) (43) Total Income Taxes (63) 6 (50) 70 (38) (1) 10 7 33 49 Net Income (Loss) $ (32) $ (51) $ (208) $ 437 $ 147 $ 953 $ 462 $ 617 $ 1,292 $ 3,324 Net Interest 11 $ 11 11 14 47 12 15 17 18 62 Income Taxes (63) $ 6 (50) 70 (38) (1) 10 7 33 49 Depreciation and Amortization Expense 387 $ 405 389 375 1,556 366 404 538 591 1,899 EBITDA $ 303 $ 371 $ 142 $ 895 $ 1,712 $ 1,329 $ 892 $ 1,179 $ 1,934 $ 5,333 Stock Based Compensation 208 $ 139 123 159 628 172 179 186 184 721 Bargain Purchase Gain - $ (30) - 17 (13) (19) - - - (19) Loss on Disposition/Impairment 0 $ 251 343 - 595 105 (18) 30 (2) 114 Acquisition Expenses - $ 3 1 - 4 (0) 3 33 11 47 Adjusted EBITDA $ 511 $ 734 $ 609 $ 1,072 $ 2,926 $ 1,586 $ 1,056 $ 1,428 $ 2,126 $ 6,196

Jake Singleton, CFO [email protected] The Joint Corp. | 16767 N. Perimeter Dr., Suite 110, Scottsdale, AZ 85260 | (480) 245 - 5960 https://www.facebook.com/thejointchiro @ thejointchiro https://twitter.com/thejointchiro @ thejointchiro https://www.youtube.com/thejointcorp @ thejointcorp Peter D. Holt, President and CEO [email protected] The Joint Corp. | 16767 N. Perimeter Dr., Suite 110, Scottsdale, AZ 85260 | (480) 245 - 5960 Kirsten Chapman, LHA Investor Relations [email protected] LHA Investor Relations | One Market Street, Spear Tower, Suite 3600, San Francisco, CA 94105 | (415) 433 - 3777 21 The Joint Corp. Contact Information © 2020 The Joint Corp. All Rights Reserved.