
Exhibit 99.2
© 2019 The Joint Corp. All Rights Reserved. 1 Q3 2019 Financial Results As of September 30, 2019 | Reported On November 7, 2019
Safe Harbor Statement © 2019 The Joint Corp. All Rights Reserved. 2 Certain statements contained in this presentation are "forward - looking statements." We have tried to identify these forward - look ing statements by using words such as "may," "might," " will," "expect,” "anticipate,'' "'believe,“ "could," " intend," "plan," "estimate," "should," "if,“ "project," and similar expressions. All st ate ments other than statements of historical facts contained in this presentation, including statements regarding our growth strategies, our vision, future operations, future financial position, future revenue, project ed costs, prospects, plans, objectives of management and expected market growth and potential are forward - looking statements. We have based these forward - looking statements on our current expectations and pro jections about future events. However, these forward - looking statements are subject to risks, uncertainties, assumptions and other factors that may cause our actual results, performance or achievem ent s to be materially different from our expectations and projections. Some of these risks, uncertainties and other factors are set forth in this presentation and in other documents we file with the United Stat es Securities and Exchange Commission (the "SEC"). Given these risks and uncertainties, readers are cautioned not to place undue reliance on our forward - looking statements. Projections and other forwar d - looking statements included in this presentation have been prepared based on assumptions, which we believe to be reasonable, but not in accordance with U.S. Generally Accepted Accounting Principals ( “GA AP”) or any guidelines of the SEC. Actual results may vary, perhaps materially. You are strongly cautioned not to place undue reliance on such projections and other forward - looking statements. All subsequent written and oral forward - looking statements attributable us or to persons acting on our behalf are expressly qualified in their entirety by these cautionary statements. Except as required by federal sec urities laws, we disclaim any intention or obligation to update or revise any forward - looking statements, whether as a result of new information, future events or otherwise. Any such forward - looking statements, whe ther made in this presentation or elsewhere, should be considered in the context of the various disclosures made by us about our businesses including, without limitation, the risk factors discussed abo ve. Accounting Adjustments Related to the Consolidation of the Operations of the PCs In those states which require a licensed Doctor of Chiropractic to own the entity that offers chiropractic services, the Comp any enters into a management agreement with a professional corporation (PC) licensed in that state to provide chiropractic services. To increase transparency into operating results and to align with ac cou nting rules, the Company will now consolidate the full operations of the PC. This will result in increases to our revenue and G&A expenses by an identical amount and would have no impact on our bottom line except in instances when the PC has sold treatment packages and wellness plans. Revenue from these packages and plans will now be deferred and will be recognized when patients use their visits. The Company ha s previously consolidated its clinic operations in Non - PC states such as Arizona and New Mexico, and the deferred revenue around packages and plans in those states was already reflected in its finan cia l statements. Therefore, these adjustments are isolated to the managed clinics in PC states. These adjustments will have no impact on cash flow. Business Structure The Joint Corp. is a franchisor of clinics and an operator of clinics in certain states. In Arkansas, California, Colorado, D ist rict of Columbia, Florida, Illinois, Kansas, Kentucky, Maryland, Massachusetts, Michigan, Minnesota, New Jersey, New York, North Carolina, Oregon, Pennsylvania, Rhode Island, South Dakota, Tennessee, Washington, Wes t V irginia and Wyoming, The Joint Corp. and its franchisees provide management services to affiliated professional chiropractic practices.
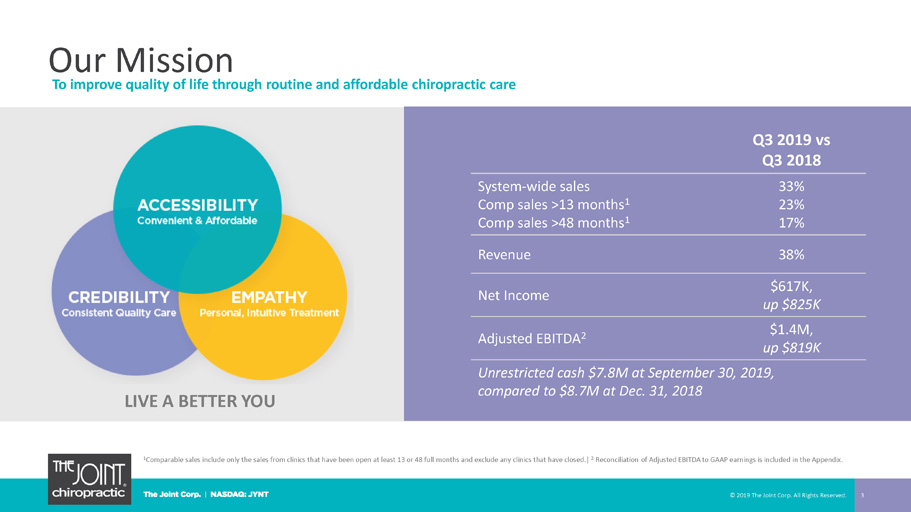
Our Mission © 2019 The Joint Corp. All Rights Reserved. 3 To improve quality of life through routine and affordable chiropractic care Q3 2019 vs Q3 2018 System - wide sales Comp sales >13 months 1 Comp sales >48 months 1 33% 23% 17% Revenue 38% Net Income $617K, up $825K Adjusted EBITDA 2 $1.4M, up $819K Unrestricted cash $7.8 M at September 30, 2019, compared to $8.7M at Dec. 31, 2018 LIVE A BETTER YOU 1 Comparable sales include only the sales from clinics that have been open at least 13 or 48 full months and exclude any clinic s t hat have closed.| 2 Reconciliation of Adjusted EBITDA to GAAP earnings is included in the Appendix.
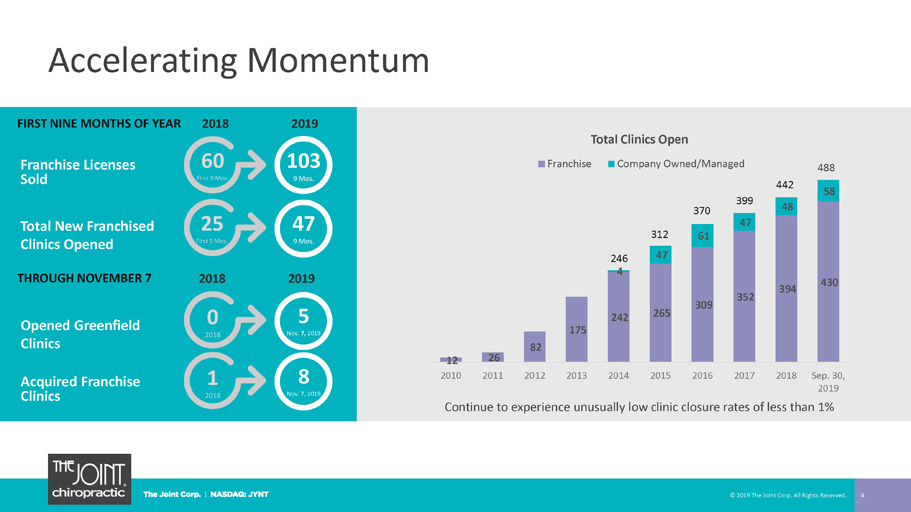
12 26 82 175 242 265 309 352 394 430 4 47 61 47 48 58 2010 2011 2012 2013 2014 2015 2016 2017 2018 Sep. 30, 2019 Total Clinics Open Franchise Company Owned/Managed Accelerating Momentum © 2019 The Joint Corp. All Rights Reserved. 4 2018 2019 0 2018 5 Nov. 7, 2019 Franchise Licenses Sold Total New Franchised Clinics Opened Opened Greenfield Clinics Acquired Franchise Clinics 2018 2019 60 First 9 Mos. 103 9 Mos. 25 First 9 Mos. 47 9 Mos. 1 2018 8 Nov. 7, 2 019 Continue to experience unusually low clinic closure rates of less than 1% 370 399 442 488 312 246 FIRST NINE MONTHS OF YEAR THROUGH NOVEMBER 7
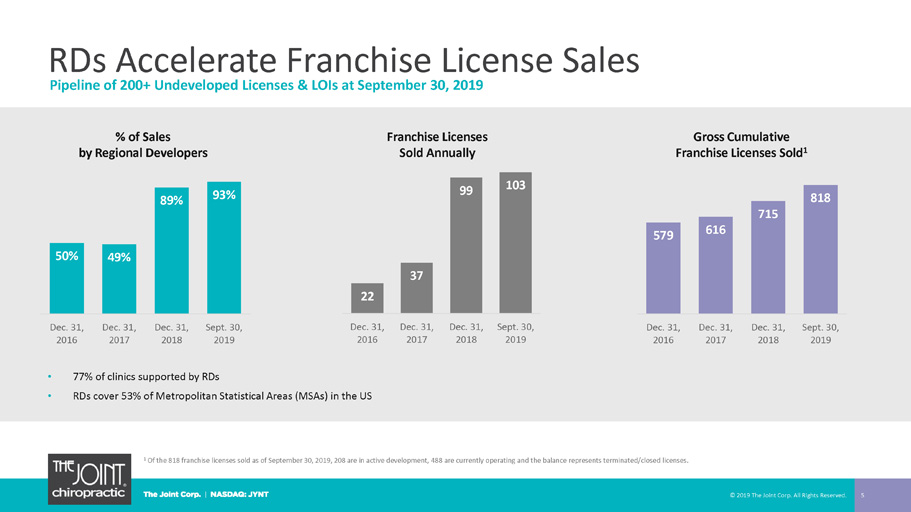
RDs Accelerate Franchise License Sales © 2019 The Joint Corp. All Rights Reserved. 5 1 Of the 818 franchise licenses sold as of September 30, 2019, 208 are in active development, 488 are currently operating and t he balance represents terminated/closed licenses. • 77% of clinics supported by RDs • RDs cover 53% of Metropolitan Statistical Areas (MSAs) in the US Pipeline of 200+ Undeveloped Licenses & LOIs at September 30, 2019 50% 49% 89% 93% Dec. 31, 2016 Dec. 31, 2017 Dec. 31, 2018 Sept. 30, 2019 % of Sales by Regional Developers Gross Cumulative Franchise Licenses Sold 1 22 37 99 103 Dec. 31, 2016 Dec. 31, 2017 Dec. 31, 2018 Sept. 30, 2019 Franchise Licenses Sold Annually 579 616 715 818 Dec. 31, 2016 Dec. 31, 2017 Dec. 31, 2018 Sept. 30, 2019
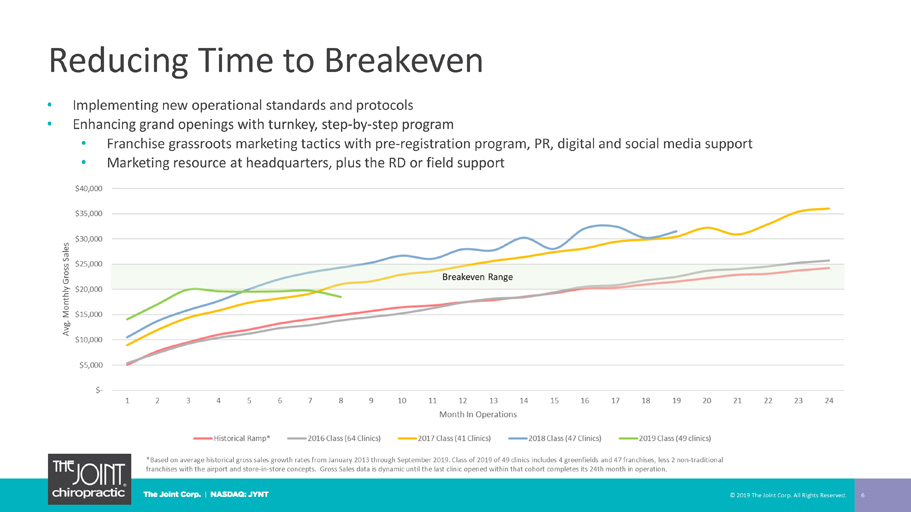
Reducing Time to Breakeven © 2019 The Joint Corp. All Rights Reserved. 6 • Implementing new operational standards and protocols • Enhancing grand openings with t urnkey, s tep - by - step program • Franchise grassroots marketing tactics with pre - registration program, PR, digital and social media support • Marketing resource at headquarters, plus the RD or field support *Based on average historical gross sales growth rates from January 2013 through September 2019. Class of 2019 of 49 clinics i ncl udes 4 greenfields and 47 franchises, less 2 non - traditional franchises with the airport and store - in - store concepts. Gross Sales data is dynamic until the last clinic opened within that cohort completes its 24th month in operation.
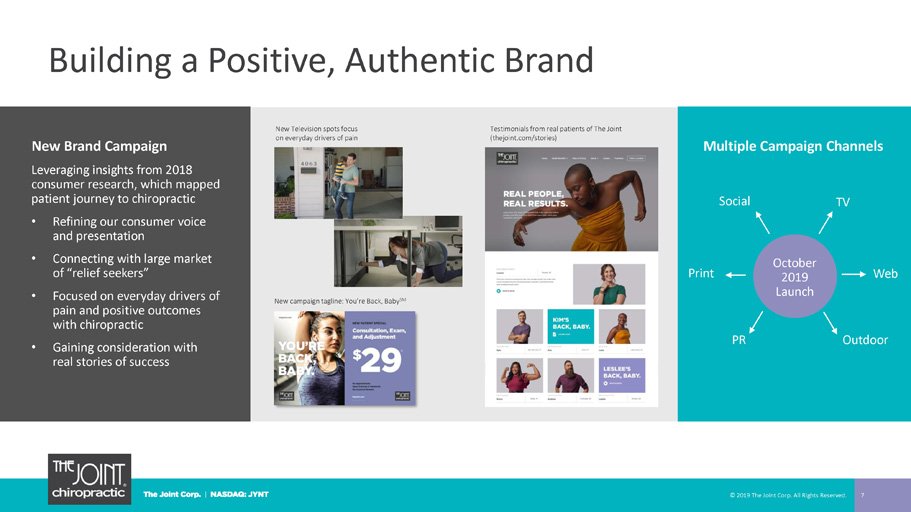
Building a Positive, Authentic Brand © 2019 The Joint Corp. All Rights Reserved. 7 Multiple Campaign Channels New Brand Campaign Leveraging insights from 2018 consumer research, which mapped patient journey to chiropractic • Refining our consumer voice and presentation • Connecting with large market of “relief seekers” • Focused on everyday drivers of pain and positive outcomes with chiropractic • Gaining consideration with real stories of success PR Web Outdoor Print Social October 2019 Launch TV New Television s pots focus on everyday drivers of pain Testimonials from real patients of The Joint (thejoint.com/stories) New campaign tagline: You’re Back, Baby SM
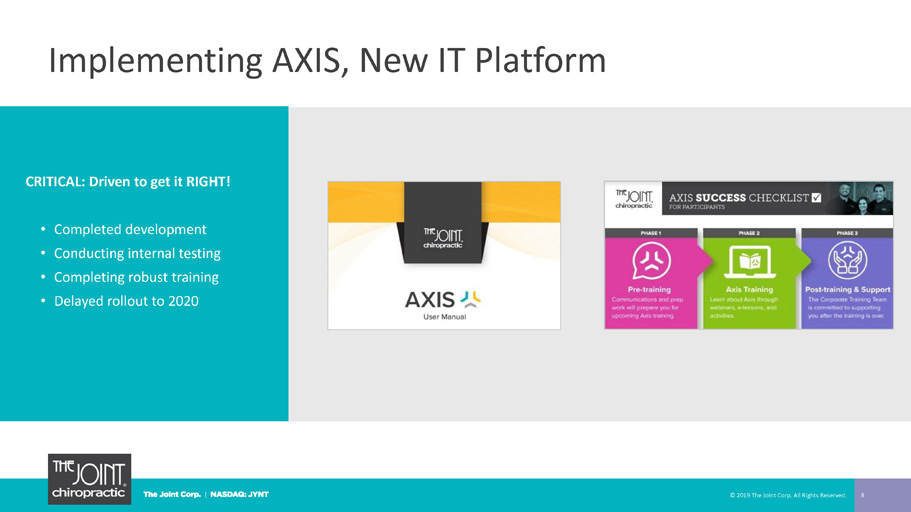
Implementing AXIS, New IT Platform © 2019 The Joint Corp. All Rights Reserved. 8 CRITICAL: Driven to get it RIGHT! • Completed development • Conducting internal testing • Completing robust training • Delayed rollout to 2020
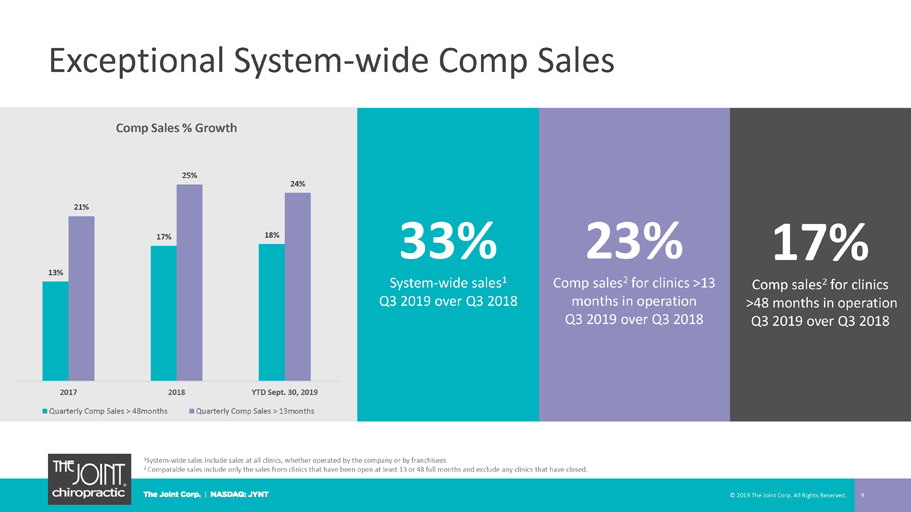
Exceptional System - wide Comp Sales © 2019 The Joint Corp. All Rights Reserved. 9 33% System - wide sales 1 Q3 2019 over Q3 2018 23% Comp sales 2 for clinics >13 months in operation Q3 2019 over Q3 2018 17% Comp sales 2 for clinics >48 months in operation Q3 2019 over Q3 2018 1 System - wide sales include sales at all clinics, whether operated by the company or by franchisees 2 Comparable sales include only the sales from clinics that have been open at least 13 or 48 full months and exclude any clinic s t hat have closed. 13% 17% 18% 21% 25% 24% 2017 2018 YTD Sept. 30, 2019 Comp Sales % Growth Quarterly Comp Sales > 48months Quarterly Comp Sales > 13months
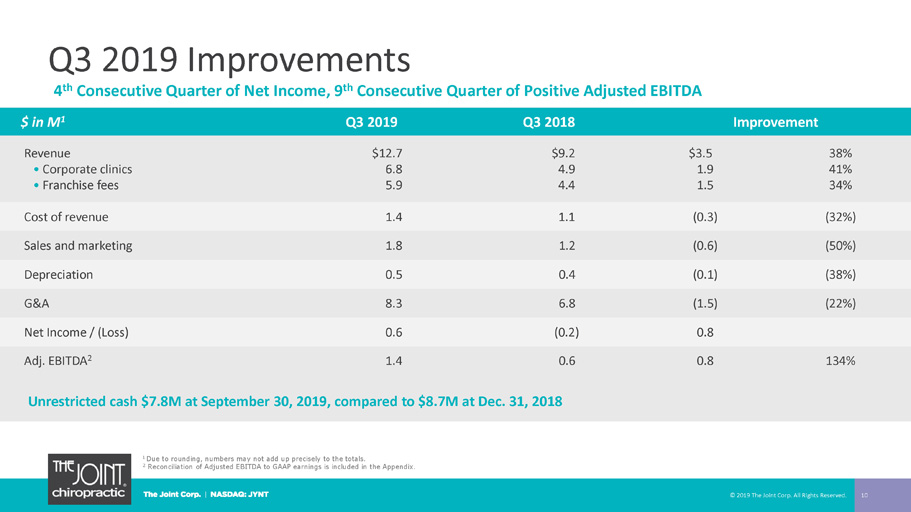
Q3 2019 Improvements © 2019 The Joint Corp. All Rights Reserved. 10 4 th Consecutive Quarter of Net Income, 9 th Consecutive Quarter of Positive Adjusted EBITDA $ in M 1 Q3 2019 Q3 2018 Improvement Revenue • Corporate clinics • Franchise fees $12.7 6.8 5.9 $9.2 4.9 4.4 $3.5 1.9 1.5 38% 41% 34% Cost of revenue 1.4 1.1 (0.3) (32%) Sales and marketing 1.8 1.2 (0.6) (50%) Depreciation 0.5 0.4 (0.1) (38%) G&A 8.3 6.8 (1.5) (22%) Net Income / (Loss) 0.6 ( 0.2) 0.8 Adj. EBITDA 2 1.4 0.6 0.8 134% Unrestricted cash $7.8M at September 30, 2019, compared to $8.7M at Dec. 31, 2018 1 Due to rounding, numbers may not add up precisely to the totals. 2 Reconciliation of Adjusted EBITDA to GAAP earnings is included in the Appendix.
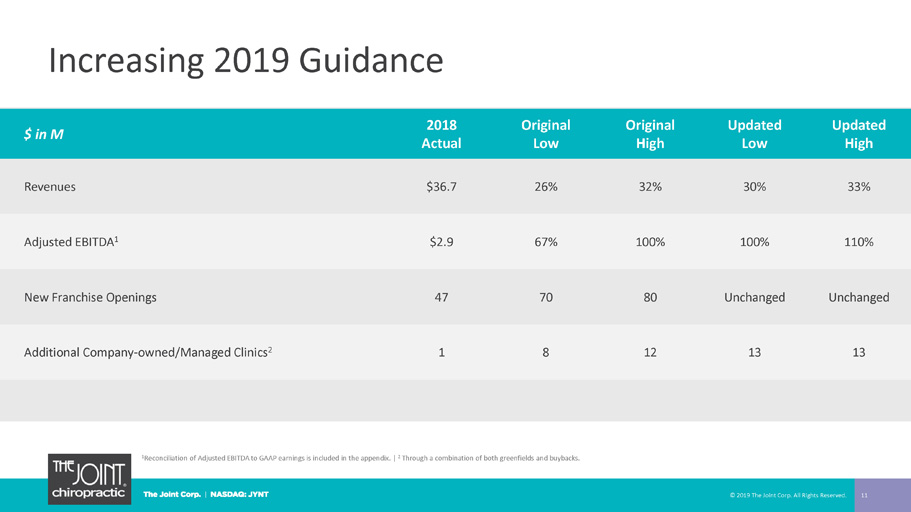
Increasing 2019 Guidance © 2019 The Joint Corp. All Rights Reserved. 11 1 Reconciliation of Adjusted EBITDA to GAAP earnings is included in the appendix. | 2 Through a combination of both greenfields and buybacks. $ in M 2018 Actual Original Low Original High Updated Low Updated High Revenues $36.7 26% 32% 30% 33% Adjusted EBITDA 1 $2.9 67% 100% 100% 110% New Franchise Openings 47 70 80 Unchanged Unchanged Additional Company - owned/Managed Clinics 2 1 8 12 13 13

© 2019 The Joint Corp. All Rights Reserved. 12 Revenue Growth Drivers Market Opportunity Expansion Strategy New Markets
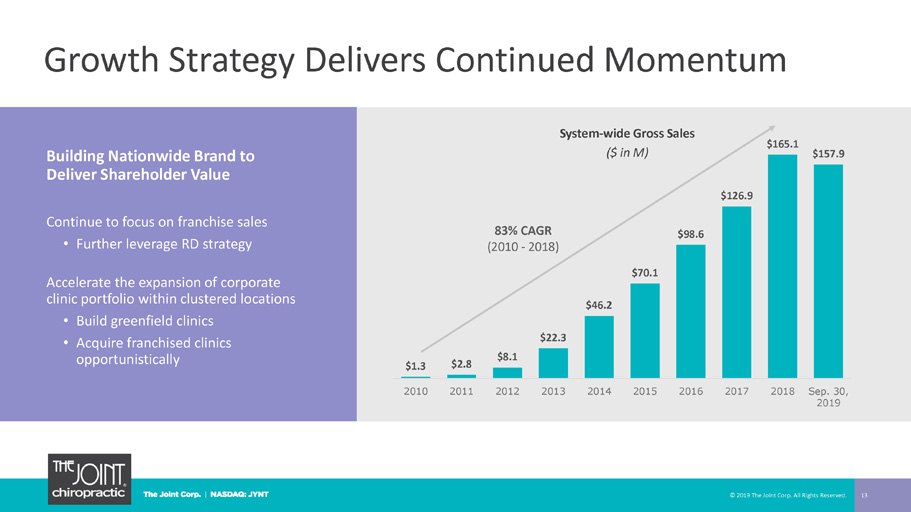
$1.3 $2.8 $8.1 $22.3 $46.2 $70.1 $98.6 $126.9 $165.1 $157.9 2010 2011 2012 2013 2014 2015 2016 2017 2018 Sep. 30, 2019 © 2019 The Joint Corp. All Rights Reserved. 13 Building Nationwide Brand to Deliver Shareholder Value Continue to focus on franchise sales • Further leverage RD strategy Accelerate the expansion of corporate clinic portfolio within clustered locations • Build greenfield clinics • Acquire franchised clinics opportunistically Growth Strategy Delivers Continued Momentum System - wide Gross Sales ($ in M) 83% CAGR (2010 - 2018)
Non - GAAP Measure Definition © 2019 The Joint Corp. All Rights Reserved. 14 This presentation includes a presentation of EBITDA and Adjusted EBITDA, which are non - GAAP financial measures. EBITDA and Adjus ted EBITDA are presented because they are important measures used by management to assess financial performance, as management believes they provide a more transparent view of the Company’s underlying operating performance and operating trends. Reconci lia tions of net loss to EBITDA and Adjusted EBITDA are presented where applicable. The Company defines EBITDA as net income (loss) bef ore net interest, taxes, depreciation and amortization expenses. The Company defines Adjusted EBITDA as EBITDA before acquisition - relate d expenses, bargain purchase gain, loss on disposition or impairment, and stock - based compensation expenses. EBITDA and Adjusted EBITDA do not represent and should not be considered alternatives to net income or cash flows from operat ion s, as determined by accounting principles generally accepted in the United States, or GAAP. While EBITDA and Adjusted EBITDA are fr equ ently used as measures of financial performance and the ability to meet debt service requirements, they are not necessarily compara ble to other similarly titled captions of other companies due to potential inconsistencies in the methods of calculation. EBITDA and Adjus ted EBITDA should be reviewed in conjunction with the Company’s financial statements filed with the SEC.
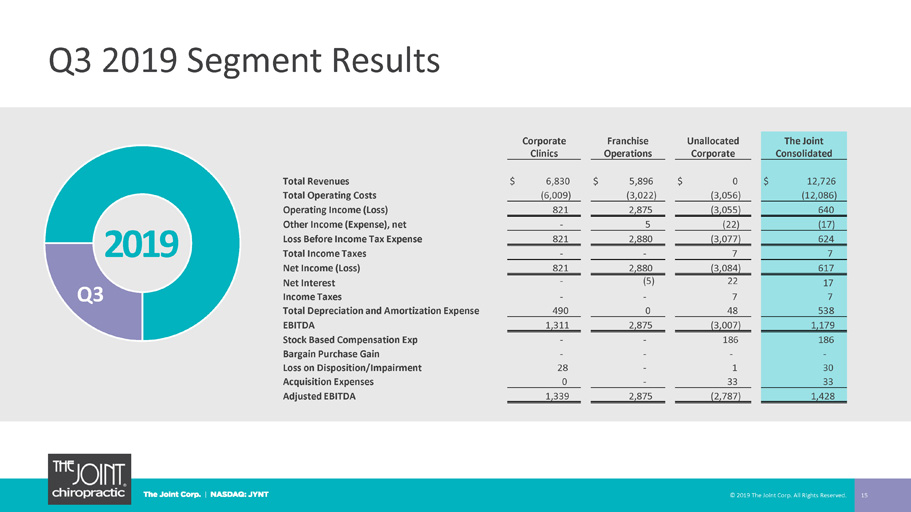
Q3 2019 Segment Results © 2019 The Joint Corp. All Rights Reserved. 15 2019 Q3 Corporate Clinics Franchise Operations Unallocated Corporate The Joint Consolidated Total Revenues $ 6,830 $ 5,896 $ 0 $ 12,726 Total Operating Costs (6,009) (3,022) (3,056) (12,086) Operating Income (Loss) 821 2,875 (3,055) 640 Other Income (Expense), net - 5 (22) (17) Loss Before Income Tax Expense 821 2,880 (3,077) 624 Total Income Taxes - - 7 7 Net Income (Loss) 821 2,880 (3,084) 617 Net Interest - (5) 22 17 Income Taxes - - 7 7 Total Depreciation and Amortization Expense 490 0 48 538 EBITDA 1,311 2,875 (3,007) 1,179 Stock Based Compensation Exp - - 186 186 Bargain Purchase Gain - - - - Loss on Disposition/Impairment 28 - 1 30 Acquisition Expenses 0 - 33 33 Adjusted EBITDA 1,339 2,875 (2,787) 1,428
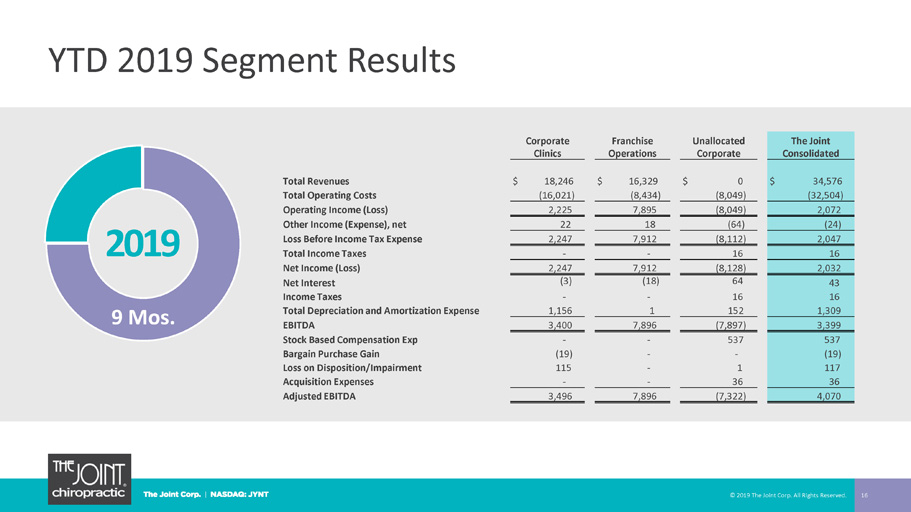
YTD 2019 Segment Results © 2019 The Joint Corp. All Rights Reserved. 16 Corporate Clinics Franchise Operations Unallocated Corporate The Joint Consolidated Total Revenues $ 18,246 $ 16,329 $ 0 $ 34,576 Total Operating Costs (16,021) (8,434) (8,049) (32,504) Operating Income (Loss) 2,225 7,895 (8,049) 2,072 Other Income (Expense), net 22 18 (64) (24) Loss Before Income Tax Expense 2,247 7,912 (8,112) 2,047 Total Income Taxes - - 16 16 Net Income (Loss) 2,247 7,912 (8,128) 2,032 Net Interest (3) (18) 64 43 Income Taxes - - 16 16 Total Depreciation and Amortization Expense 1,156 1 152 1,309 EBITDA 3,400 7,896 (7,897) 3,399 Stock Based Compensation Exp - - 537 537 Bargain Purchase Gain (19) - - (19) Loss on Disposition/Impairment 115 - 1 117 Acquisition Expenses - - 36 36 Adjusted EBITDA 3,496 7,896 (7,322) 4,070 2019 9 Mos.
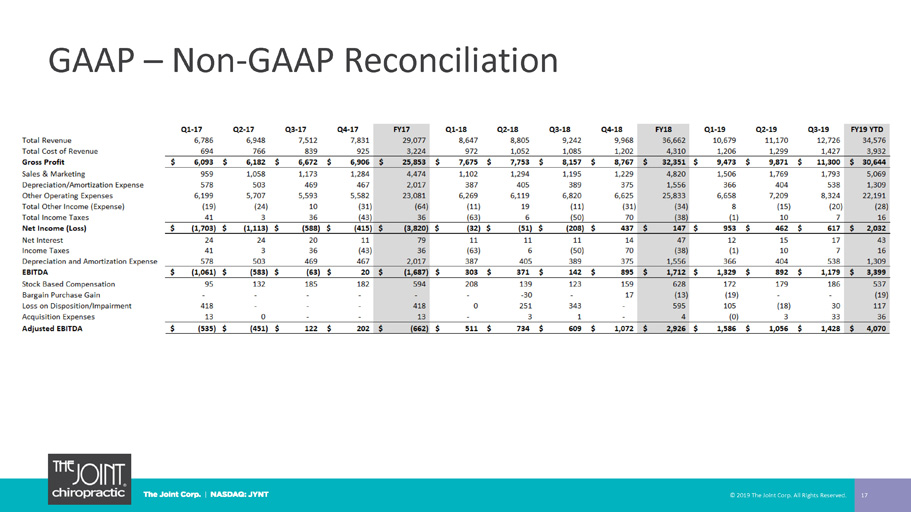
GAAP – Non - GAAP Reconciliation © 2019 The Joint Corp. All Rights Reserved. 17

Jake Singleton, CFO [email protected] The Joint Corp. | 16767 N. Perimeter Dr., Suite 240, Scottsdale, AZ 85260 | (480) 245 - 5960 https://www.facebook.com/thejointchiro @ thejointchiro https://twitter.com/thejointchiro @ thejointchiro https://www.youtube.com/thejointcorp @ thejointcorp Peter D. Holt, President and CEO [email protected] The Joint Corp. | 16767 N. Perimeter Dr., Suite 240, Scottsdale, AZ 85260 | (480) 245 - 5960 Kirsten Chapman, LHA Investor Relations [email protected] LHA Investor Relations | One Market Street, Spear Tower, Suite 3600, San Francisco, CA 94105 | (415) 433 - 3777 © 2019 The Joint Corp. All Rights Reserved. 18 The Joint Corp. Contact Information