
EXHIBIT 99.2
THE JOINT CORP. | NASDAQ: JYNT | thejoint.com Q2 2019 FINANCIAL RESULTS AS OF JUNE 30, 2019 REPORTED AUGUST 8, 2019 © 2019 The Joint Corp. All Rights Reserved.
Safe Harbor Statements Forward looking Statements Certain statements contained in this presentation are "forward - looking statements." We have tried to identify these forward - look ing statements by using words such as "may," "might," " will," "expect,” "anticipate,'' "'believe,“ "could," " intend," "plan," "estimate," "should," "if,“ "pro jec t," and similar expressions. All statements other than statements of historical facts contained in this presentation, including statements regarding our growth strategies, our vision, future ope rat ions, future financial position, future revenue, projected costs, prospects, plans, objectives of management and expected market growth and potential are forward - looking statements. We have base d these forward - looking statements on our current expectations and projections about future events. However, these forward - looking statements are subject to risks, uncertainties, assumptions and other factors that may cause our actual results, performance or achievements to be materially different from our expectations and projections. Some of these risks, uncertaint ies and other factors are set forth in this presentation and in other documents we file with the United States Securities and Exchange Commission (the "SEC"). Given these risks and uncertainties, re aders are cautioned not to place undue reliance on our forward - looking statements. Projections and other forward - looking statements included in this presentation have been prepared based on a ssumptions, which we believe to be reasonable, but not in accordance with U.S. Generally Accepted Accounting Principals (“GAAP”) or any guidelines of the SEC. Actual results may vary, pe rhaps materially. You are strongly cautioned not to place undue reliance on such projections and other forward - looking statements. All subsequent written and oral forward - looking statements at tributable us or to persons acting on our behalf are expressly qualified in their entirety by these cautionary statements. Except as required by federal securities laws, we disclaim any in ten tion or obligation to update or revise any forward - looking statements, whether as a result of new information, future events or otherwise. Any such forward - looking statements, whether made in this pr esentation or elsewhere, should be considered in the context of the various disclosures made by us about our businesses including, without limitation, the risk factors discussed above. Accounting Related to the Consolidation of the Operations of the PCs In those states which require a licensed Doctor of Chiropractic to own the entity that offers chiropractic services, the Comp any enters into a management agreement with a professional corporation (PC) licensed in that state to provide chiropractic services. To increase transparency into operating results and to align wi th accounting rules, the Company consolidates the full operations of the PC. This results in increases to our revenue and G&A expenses by an identical amount and has no impact on our bottom line except in instances when the PC has sold treatment packages and wellness plans. Revenue from these packages and plans are deferred and recognized when patients use their visits. The Company has pre vio usly consolidated its clinic operations in Non - PC states such as Arizona and New Mexico, and the deferred revenue around packages and plans in those states was already reflected in its finan cia l statements. Therefore, these adjustments are isolated to the managed clinics in PC states. These adjustments have no impact on cash flow. Definition of System - wide and Comparison Sales System - wide sales include sales at all clinics, whether operated by the Company or by franchisees. While franchised sales are no t recorded as revenues by the Company, management believes the information is important in understanding the Company’s financial performance, because these sales are the basis on which the Co mpany calculates and records royalty fees and are indicative of the financial health of the franchisee base. Comparison, or comp, sales include the sales from both company - owned or managed cli nics and franchised clinics that in each case have been open at least 13 or 48 full months and exclude any clinics that have closed, respectively. Business Structure The Joint Corp. is a franchisor of clinics and an operator of clinics in certain states. In Arkansas, California, Colorado, D ist rict of Columbia, Florida, Illinois, Kansas, Kentucky, Maryland, Massachusetts, Michigan, Minnesota, New Jersey, New York, North Carolina, Oregon, Pennsylvania, Rhode Island, South Da kota, Tennessee, Washington, West Virginia and Wyoming, The Joint Corp. and its franchisees provide management services to affiliated professional chiropractic practice s. 2 © 2019 The Joint Corp. All Rights Reserved.
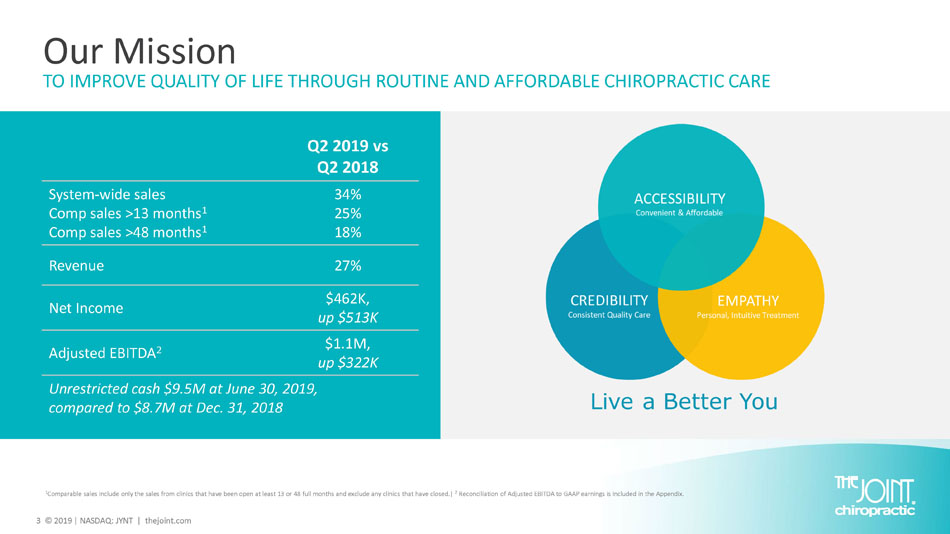
3 © 2019 | NASDAQ: JYNT | thejoint.com 1 Comparable sales include only the sales from clinics that have been open at least 13 or 48 full months and exclude any clinic s t hat have closed.| 2 Reconciliation of Adjusted EBITDA to GAAP earnings is included in the Appendix. Our Mission TO IMPROVE QUALITY OF LIFE THROUGH ROUTINE AND AFFORDABLE CHIROPRACTIC CARE Q2 2019 vs Q2 2018 System - wide sales Comp sales >13 months 1 Comp sales >48 months 1 34% 25% 18% Revenue 27% Net Income $462K, up $513K Adjusted EBITDA 2 $1.1M, up $322K Unrestricted cash $9.5 M at June 30, 2019, compared to $8.7M at Dec. 31, 2018
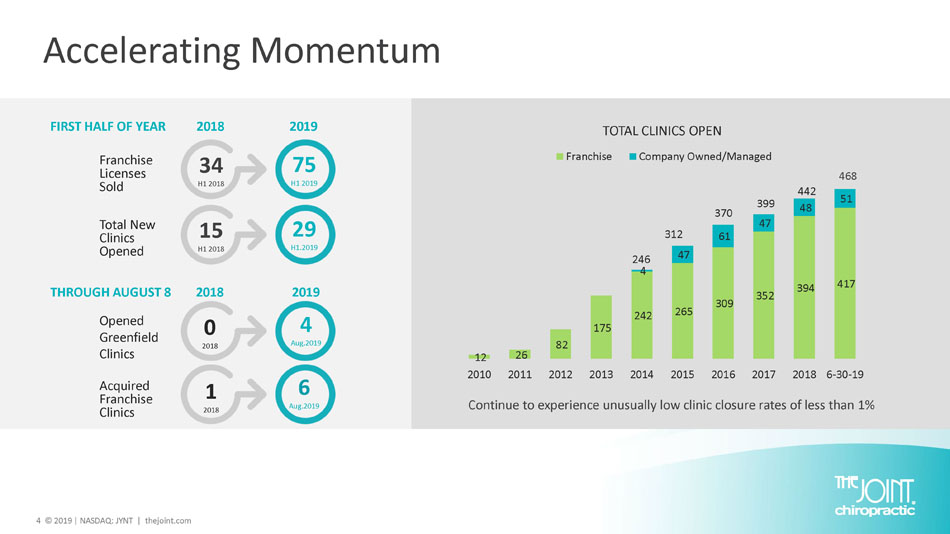
4 © 2019 | NASDAQ: JYNT | thejoint.com 12 26 82 175 242 265 309 352 394 417 4 47 61 47 48 51 2010 2011 2012 2013 2014 2015 2016 2017 2018 6-30-19 TOTAL CLINICS OPEN Franchise Company Owned/Managed Accelerating Momentum Continue to experience unusually low clinic closure rates of less than 1% 312 370 399 246 442 468 0 2018 4 Aug.2019 Franchise Licenses Sold Total New Clinics Opened Opened Greenfield Clinics Acquired Franchise Clinics FIRST HALF OF YEAR 2018 2019 THROUGH AUGUST 8 2018 2019 34 H1 2018 75 H1 2019 15 H1 2018 29 H1.2019 1 2018 6 Aug.2019
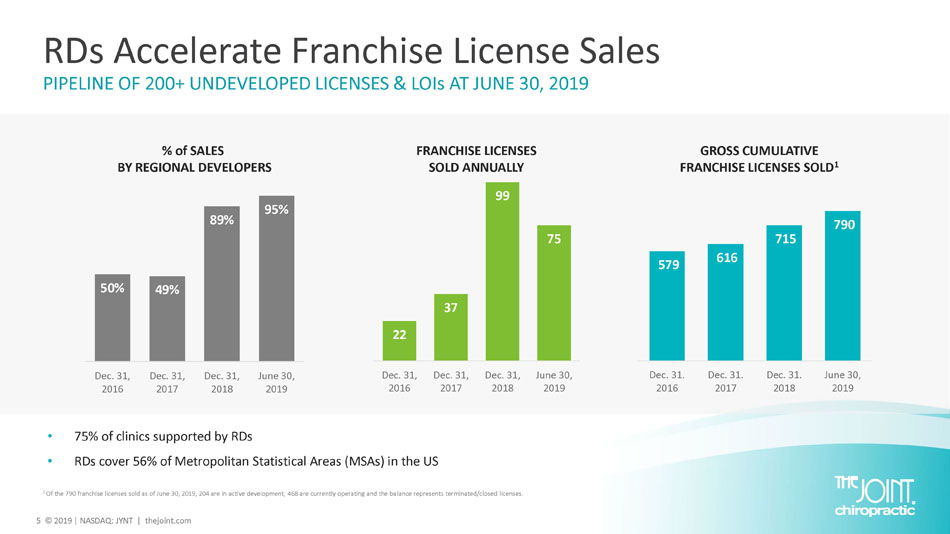
5 © 2019 | NASDAQ: JYNT | thejoint.com 50% 49% 89% 95% Dec. 31, 2016 Dec. 31, 2017 Dec. 31, 2018 June 30, 2019 RDs Accelerate Franchise License Sales PIPELINE OF 200+ UNDEVELOPED LICENSES & LOIs AT JUNE 30, 2019 % of SALES BY REGIONAL DEVELOPERS GROSS CUMULATIVE FRANCHISE LICENSES SOLD 1 22 37 99 75 Dec. 31, 2016 Dec. 31, 2017 Dec. 31, 2018 June 30, 2019 FRANCHISE LICENSES SOLD ANNUALLY 1 Of the 790 franchise licenses sold as of June 30, 2019, 204 are in active development, 468 are currently operating and the ba lan ce represents terminated/closed licenses. • 75% of clinics supported by RDs • RDs cover 56% of Metropolitan Statistical Areas ( MSAs ) in the US 579 616 715 790 Dec. 31. 2016 Dec. 31. 2017 Dec. 31. 2018 June 30, 2019
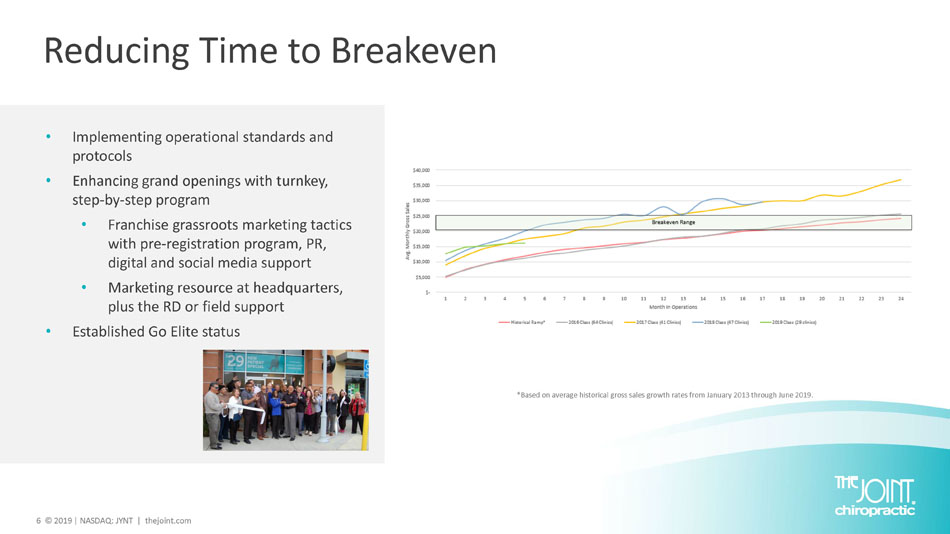
6 © 2019 | NASDAQ: JYNT | thejoint.com Reducing Time to Breakeven • Implementing operational standards and protocols • Enhancing grand openings with t urnkey, s tep - by - step program • Franchise grassroots marketing tactics with pre - registration program, PR, digital and social media support • Marketing resource at headquarters, plus the RD or field support • Established Go Elite status *Based on average historical gross sales growth rates from January 2013 through June 2019.
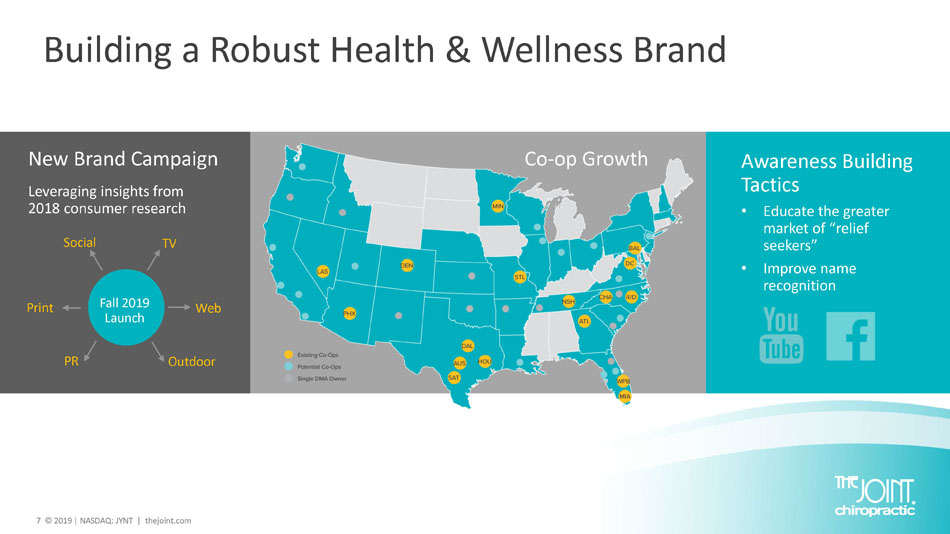
7 © 2019 | NASDAQ: JYNT | thejoint.com Building a Robust Health & Wellness Brand Awareness Building Tactics • Educate the greater market of “relief seekers” • Improve name recognition New Brand Campaign Leveraging insights from 2018 consumer research PR Web Outdoor Print Social Fall 2019 Launch TV Co - op Growth
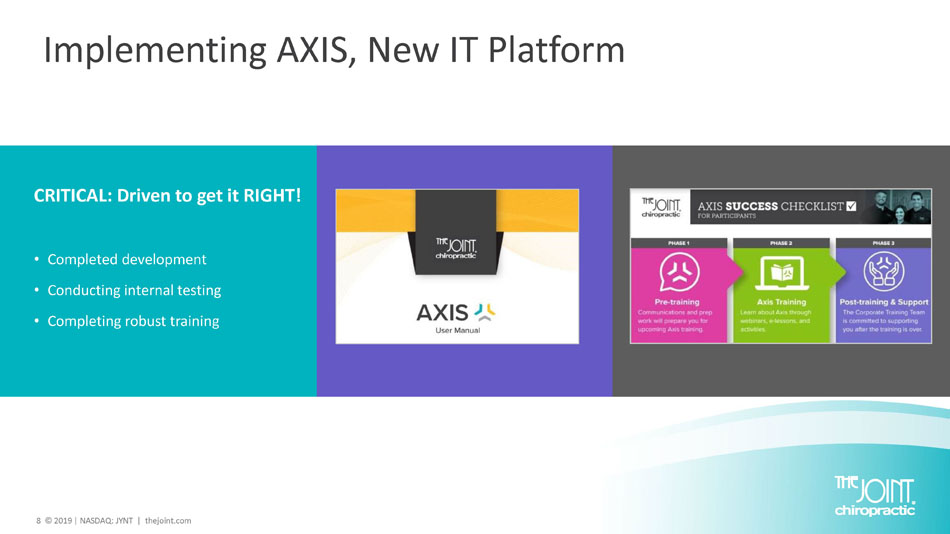
8 © 2019 | NASDAQ: JYNT | thejoint.com Implementing AXIS, New IT Platform CRITICAL: Driven to get it RIGHT! • Completed development • Conducting internal testing • Completing robust training
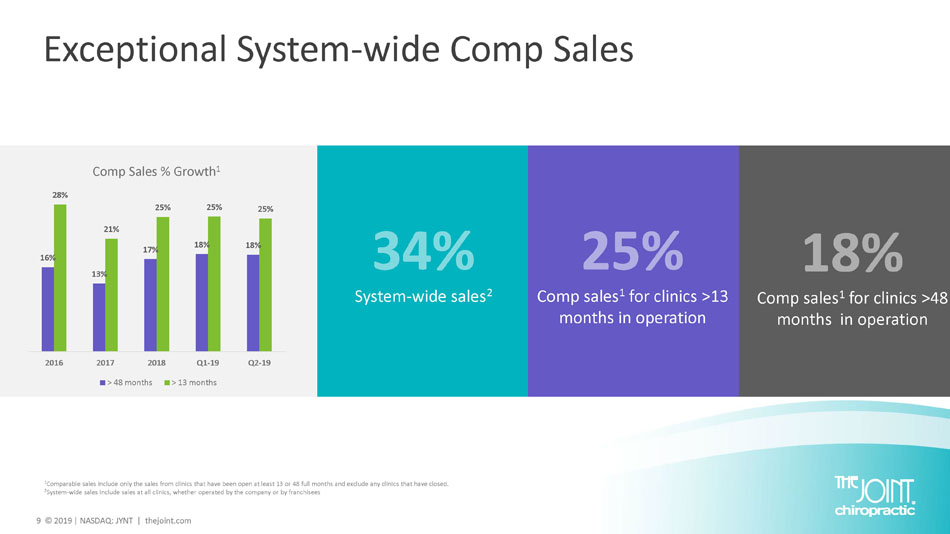
9 © 2019 | NASDAQ: JYNT | thejoint.com System - wide sales 2 Comp sales 1 for clinics >13 months in operation Comp sales 1 for clinics >48 months in operation Exceptional System - wide Comp Sales 1 Comparable sales include only the sales from clinics that have been open at least 13 or 48 full months and exclude any clinic s t hat have closed. 2 System - wide sales include sales at all clinics, whether operated by the company or by franchisees 16% 13% 17% 18% 18% 28% 21% 25% 25% 25% 2016 2017 2018 Q1-19 Q2-19 Comp Sales % Growth 1 > 48 months > 13 months
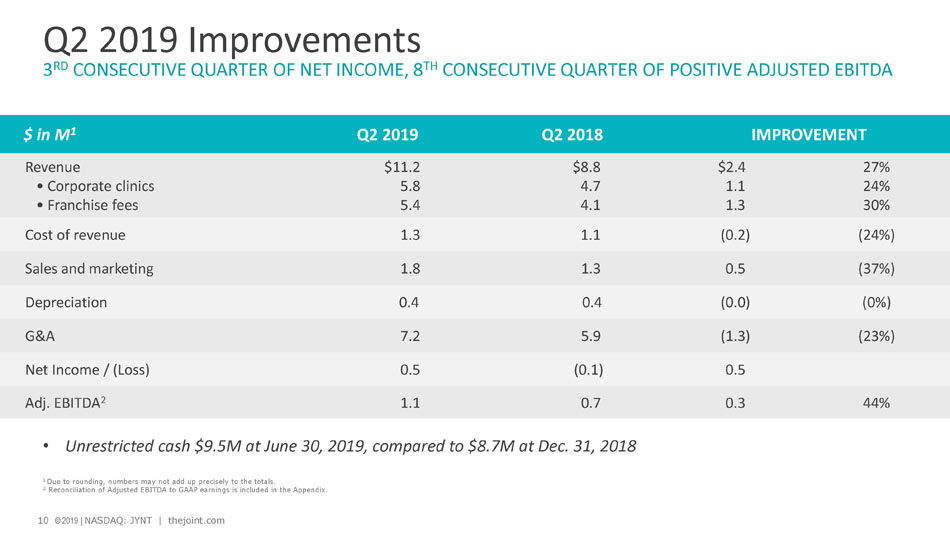
10 © 2019 | NASDAQ: JYNT | thejoint.com Achi $ in M 1 Q2 2019 Q2 2018 IMPROVEMENT Revenue • Corporate clinics • Franchise fees $11.2 5.8 5.4 $8.8 4.7 4.1 $2.4 1.1 1.3 27% 24% 30% Cost of revenue 1.3 1.1 (0.2) (24%) Sales and marketing 1.8 1.3 0.5 (37%) Depreciation 0.4 0.4 (0.0) (0%) G&A 7.2 5.9 (1.3) (23%) Net Income / (Loss) 0.5 (0.1) 0.5 Adj. EBITDA 2 1.1 0.7 0.3 44% Q2 2019 Improvements 3 RD CONSECUTIVE QUARTER OF NET INCOME, 8 TH CONSECUTIVE QUARTER OF POSITIVE ADJUSTED EBITDA 10 © 2019 | NASDAQ: JYNT | thejoint.com 1 Due to rounding, numbers may not add up precisely to the totals. 2 Reconciliation of Adjusted EBITDA to GAAP earnings is included in the Appendix. • Unrestricted cash $9.5M at June 30, 2019, compared to $8.7M at Dec. 31, 2018
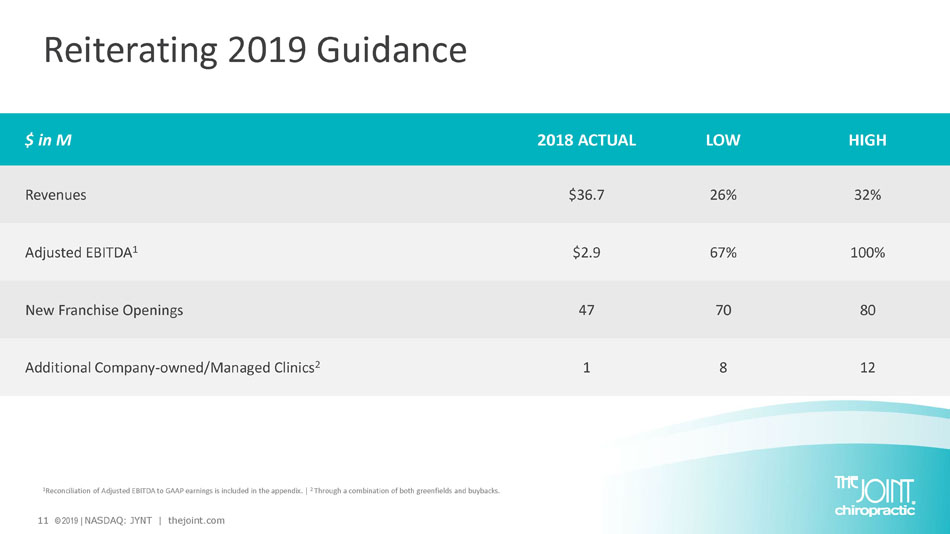
11 © 2019 | NASDAQ: JYNT | thejoint.com $ in M 2018 ACTUAL LOW HIGH Revenues $36.7 26% 32% Adjusted EBITDA 1 $2.9 67% 100% New Franchise Openings 47 70 80 Additional Company - owned/Managed Clinics 2 1 8 12 Reiterating 2019 Guidance 1 Reconciliation of Adjusted EBITDA to GAAP earnings is included in the appendix. | 2 Through a combination of both greenfields and buybacks.
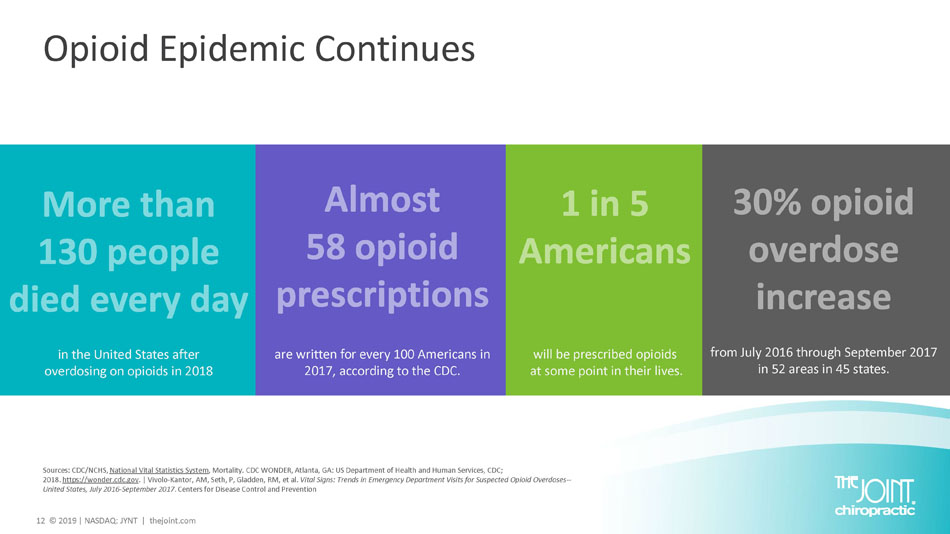
12 © 2019 | NASDAQ: JYNT | thejoint.com Opioid Epidemic Continues are written for every 100 Americans in 2017, according to the CDC. will be prescribed opioids at some point in their lives. from July 2016 through September 2017 in 52 areas in 45 states. in the United States after overdosing on opioids in 2018 Sources: CDC/NCHS, National Vital Statistics System , Mortality. CDC WONDER, Atlanta, GA: US Department of Health and Human Services, CDC; 2018. https://wonder.cdc.gov . | Vivolo - Kantor, AM, Seth, P, Gladden, RM, et al. Vital Signs: Trends in Emergency Department Visits for Suspected Opioid Overdoses -- United States, July 2016 - September 2017 . Centers for Disease Control and Prevention
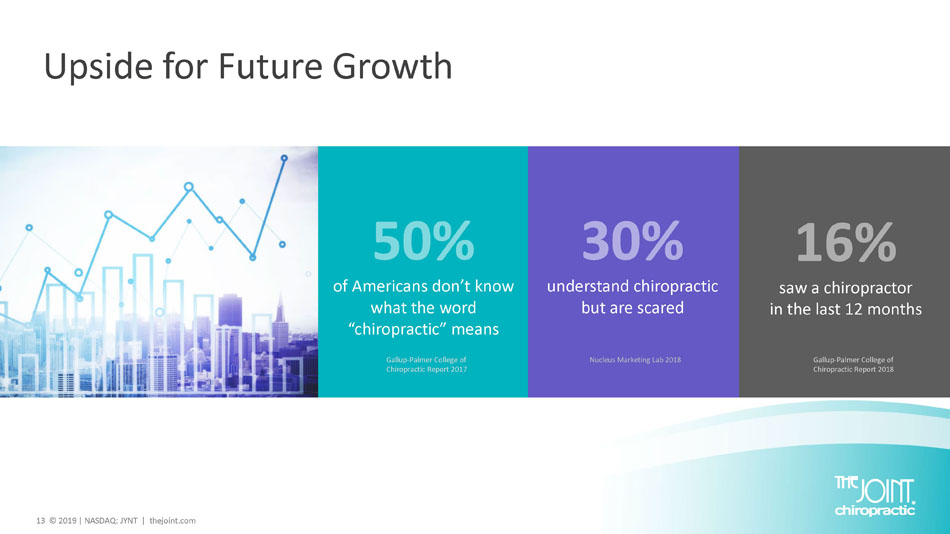
13 © 2019 | NASDAQ: JYNT | thejoint.com Upside for Future Growth of Americans don’t know what the word “chiropractic” means saw a chiropractor in the last 12 months understand chiropractic but are scared Gallup - Palmer College of Chiropractic Report 2017 Gallup - Palmer College of Chiropractic Report 2018 Nucleus Marketing Lab 2018
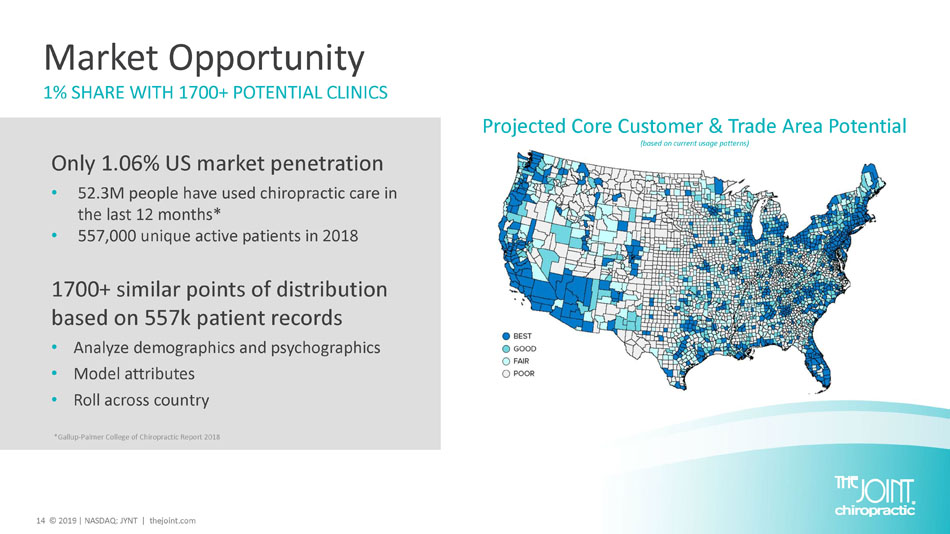
14 © 2019 | NASDAQ: JYNT | thejoint.com Market Opportunity 1% SHARE WITH 1700+ POTENTIAL CLINICS Only 1.06% US market penetration • 52.3M people have used chiropractic care in the last 12 months* • 557,000 unique active patients in 2018 1700+ similar points of distribution based on 557k patient records • Analyze demographics and psychographics • Model attributes • Roll across country Projected Core Customer & Trade Area Potential (based on current usage patterns) *Gallup - Palmer College of Chiropractic Report 2018
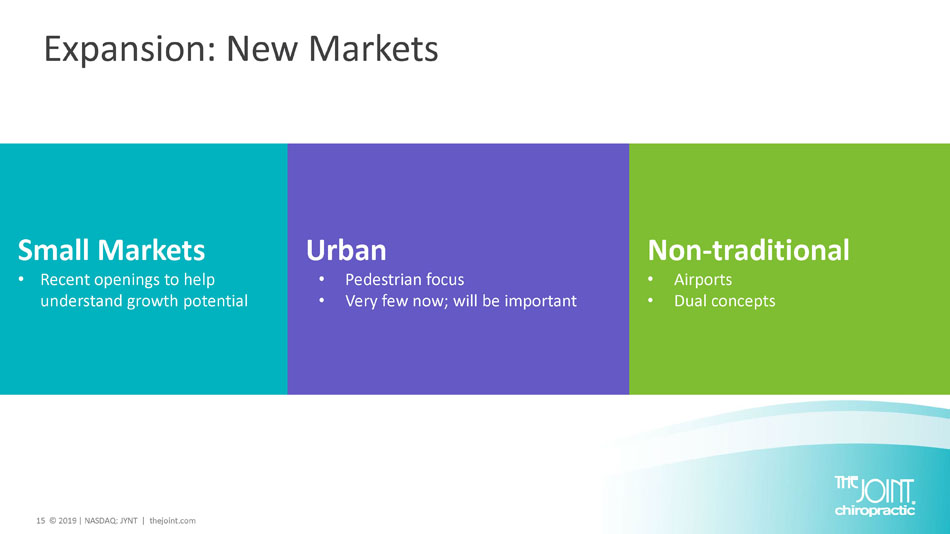
15 © 2019 | NASDAQ: JYNT | thejoint.com Expansion: New Markets Small Markets • Recent openings to help understand growth potential Urban • Pedestrian focus • Very few now; will be important Non - traditional • Airports • Dual concepts
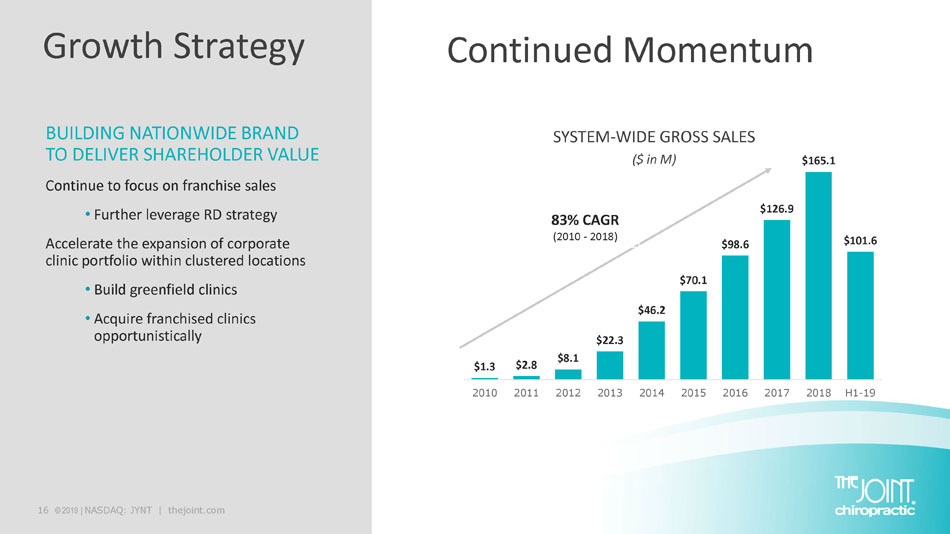
16 © 2019 | NASDAQ: JYNT | thejoint.com Growth Strategy BUILDING NATIONWIDE BRAND TO DELIVER SHAREHOLDER VALUE Continue to focus on franchise sales • Further leverage RD strategy Accelerate the expansion of corporate clinic portfolio within clustered locations • Build greenfield clinics • Acquire franchised clinics opportunistically Continued Momentum SYSTEM - WIDE GROSS SALES ($ in M) 83% CAGR (2010 - 2018) $1.3 $2.8 $8.1 $22.3 $46.2 $70.1 $98.6 $126.9 $165.1 $101.6 2010 2011 2012 2013 2014 2015 2016 2017 2018 H1-19
Non - GAAP Measure Definition This presentation includes a presentation of EBITDA and Adjusted EBITDA, which are non - GAAP financial measures. EBITDA and Adjusted EBITDA are presented because they are important measures used by management to assess financial performance, as management believes they provide a more transparent view of the Company’s underlying operating performance and operating trends. Reconciliations of net loss to EBITDA and Adjusted EBITDA are presented where applicable. The Company defines EBITDA as net income (loss) before net interest, taxes, depreciation and amortization expenses. The Company defines Adjusted EBITDA as EBITDA before acquisition - related expenses, bargain purchase gain, loss on disposition or impairment, and stock - based compensation expenses. EBITDA and Adjusted EBITDA do not represent and should not be considered alternatives to net income or cash flows from operations, as determined by accounting principles generally accepted in the United States, or GAAP. While EBITDA and Adjusted EBITDA are frequently used as measures of financial performance and the ability to meet debt service requirements, they are not necessarily comparable to other similarly titled captions of other companies due to potential inconsistencies in the methods of calculation. EBITDA and Adjusted EBITDA should be reviewed in conjunction with the Company’s financial statements filed with the SEC. 17 © 2019 | NASDAQ: JYNT | thejoint.com
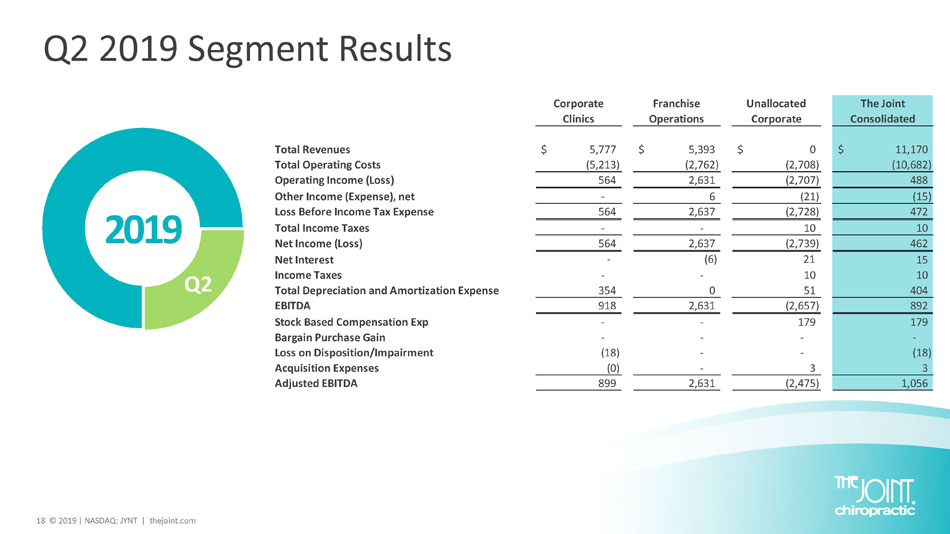
18 © 2019 | NASDAQ: JYNT | thejoint.com Q2 2019 Segment Results 2019 Q2 Corporate Clinics Franchise Operations Unallocated Corporate The Joint Consolidated Total Revenues 5,777$ 5,393$ 0$ 11,170$ Total Operating Costs (5,213) (2,762) (2,708) (10,682) Operating Income (Loss) 564 2,631 (2,707) 488 Other Income (Expense), net - 6 (21) (15) Loss Before Income Tax Expense 564 2,637 (2,728) 472 Total Income Taxes - - 10 10 Net Income (Loss) 564 2,637 (2,739) 462 Net Interest - (6) 21 15 Income Taxes - - 10 10 Total Depreciation and Amortization Expense 354 0 51 404 EBITDA 918 2,631 (2,657) 892 Stock Based Compensation Exp - - 179 179 Bargain Purchase Gain - - - - Loss on Disposition/Impairment (18) - - (18) Acquisition Expenses (0) - 3 3 Adjusted EBITDA 899 2,631 (2,475) 1,056
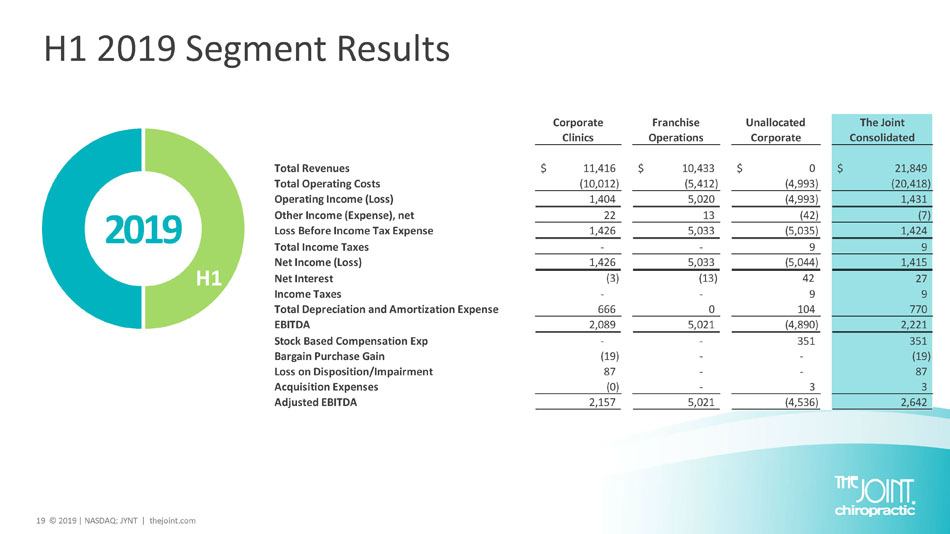
19 © 2019 | NASDAQ: JYNT | thejoint.com H1 2019 Segment Results 2019 H1 Corporate Clinics Franchise Operations Unallocated Corporate The Joint Consolidated Total Revenues 11,416$ 10,433$ 0$ 21,849$ Total Operating Costs (10,012) (5,412) (4,993) (20,418) Operating Income (Loss) 1,404 5,020 (4,993) 1,431 Other Income (Expense), net 22 13 (42) (7) Loss Before Income Tax Expense 1,426 5,033 (5,035) 1,424 Total Income Taxes - - 9 9 Net Income (Loss) 1,426 5,033 (5,044) 1,415 Net Interest (3) (13) 42 27 Income Taxes - - 9 9 Total Depreciation and Amortization Expense 666 0 104 770 EBITDA 2,089 5,021 (4,890) 2,221 Stock Based Compensation Exp - - 351 351 Bargain Purchase Gain (19) - - (19) Loss on Disposition/Impairment 87 - - 87 Acquisition Expenses (0) - 3 3 Adjusted EBITDA 2,157 5,021 (4,536) 2,642
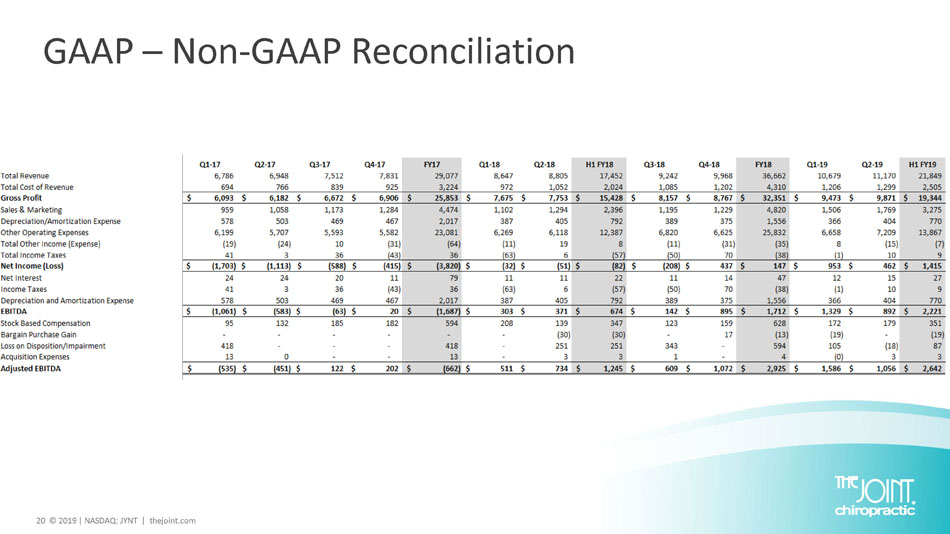
20 © 2019 | NASDAQ: JYNT | thejoint.com GAAP – Non - GAAP Reconciliation

21 © 2019 | NASDAQ: JYNT | thejoint.com Peter D. Holt, President and CEO [email protected] Jake Singleton, CFO [email protected] Kirsten Chapman, LHA Investor Relations [email protected] The Joint Corp. Contact Information https://www.facebook.com/thejointchiro @ thejointchiro https://twitter.com/thejointchiro @ thejointchiro https://www.youtube.com/thejointcorp @ thejointcorp The Joint Corp. | 16767 N. Perimeter Dr., Suite 240 | Scottsdale, AZ 85260 | (480) 245 - 5960