
EXHIBIT 99.2
REVOLUTIONIZING ACCESS TO CHIROPRACTIC CARE THE JOINT CORP. | NASDAQ: JYNT | thejoint.com Q4 2018 FINANCIAL RESULTS AS OF DECEMBER 31, 2018 REPORTED MARCH 7, 2019 © 2019 The Joint Corp. All Rights Reserved.
Safe Harbor Statement Certain statements contained in this presentation are "forward - looking statements." We have tried to identify these forward - look ing statements by using words such as "may," "might," " will," "expect,” "anticipate,'' "'believe,“ "could," " intend," "plan," "estimate," "should," "if,“ "project," and similar expressio ns. All statements other than statements of historical facts contained in this presentation, including statements regarding our growth strategies, our vision, future operations, future financial posi tio n, future revenue, projected costs, prospects, plans, objectives of management and expected market growth and potential are forward - looking statements. We have based these forward - looking statemen ts on our current expectations and projections about future events. However, these forward - looking statements are subject to risks, uncertainties, assumptions and other factors that may cause our actual results, performance or achievements to be materially different from our expectations and projections. Some of these risks, uncertainties and other factors are set f ort h in this presentation and in other documents we file with the United States Securities and Exchange Commission (the "SEC"). Given these risks and uncertainties, readers are cautioned not to place undue reliance on our forward - looking statements. Projec tions and other forward - looking statements included in this presentation have been prepared based on assumptions, which we believe to be reasonable, but not in accordance with U.S. Gene ral ly Accepted Accounting Principals (“GAAP”) or any guidelines of the SEC. Actual results may vary, perhaps materially. You are strongly cautioned not to place undue reliance on su ch projections and other forward - looking statements. All subsequent written and oral forward - looking statements attributable us or to persons acting on our behalf are expressly qualifie d in their entirety by these cautionary statements. Except as required by federal securities laws, we disclaim any intention or obligation to update or revise any forward - looking statements, whether as a result of new information, future events or otherwise. Any such forward - looking statements, whether made in this presentation or elsewhere, should be considered in the cont ext of the various disclosures made by us about our businesses including, without limitation, the risk factors discussed above. In addition to results presented in accordance with U.S. GAAP, this presentation includes a presentation of EBITDA and Adjust ed EBITDA, which are non - GAAP financial measures. EBITDA and Adjusted EBITDA are presented because they are important measures used by management to assess financial performance, as mana gem ent believes they provide a more transparent view of the Company’s underlying operating performance and operating trends. Reconciliations of net loss to EBITDA and Adjusted EBITD A a re presented where applicable. We define EBITDA as net income (loss) before net interest, taxes, depreciation and amortization expenses. We define Adjusted EBITDA as EBITDA before acq uisition - related expenses, bargain purchase gain, loss on disposition or impairment, and stock - based compensation expenses. EBITDA and Adjusted EBITDA do not represent and should not be considered alternatives to net income or cash flows from operat ion s, as determined by GAAP. While EBITDA and Adjusted EBITDA are frequently used as measures of financial performance and the ability to meet debt service requirements, they are n ot necessarily comparable to other similarly titled captions of other companies due to potential inconsistencies in the methods of calculation. EBITDA and Adjusted EBITDA should be reviewed in conjunction with our financial statements filed with the SEC. Business Structure The Joint Corp. is a franchisor of clinics and an operator of clinics in certain states. In Arkansas, California, Colorado, D ist rict of Columbia, Florida, Illinois, Kansas, Kentucky, Maryland, Massachusetts, Michigan, Minnesota, New Jersey, New York, North Carolina, Oregon, Penns ylv ania, Rhode Island, South Dakota, Tennessee, Washington, West Virginia and Wyoming, The Joint Corp. and its franchisees provide man age ment services to affiliated professional chiropractic practices. 2 © 2019 | NASDAQ: JYNT | thejoint.com
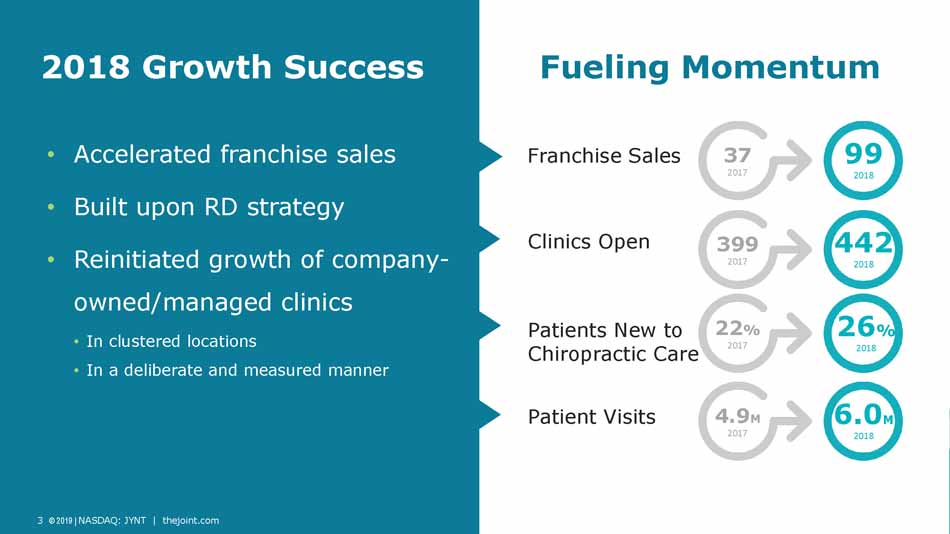
3 © 2019 | NASDAQ: JYNT | thejoint.com Achi 2018 Growth Success Fueling Momentum • Accelerated franchise sales • Built upon RD strategy • Reinitiated growth of company - owned/managed clinics • In clustered locations • In a deliberate and measured manner 37 2017 99 2018 22 % 2017 26 % 2018 399 2017 442 2018 4.9 M 2017 6.0 M 2018 Franchise Sales Clinics Open Patients New to Chiropractic Care Patient Visits
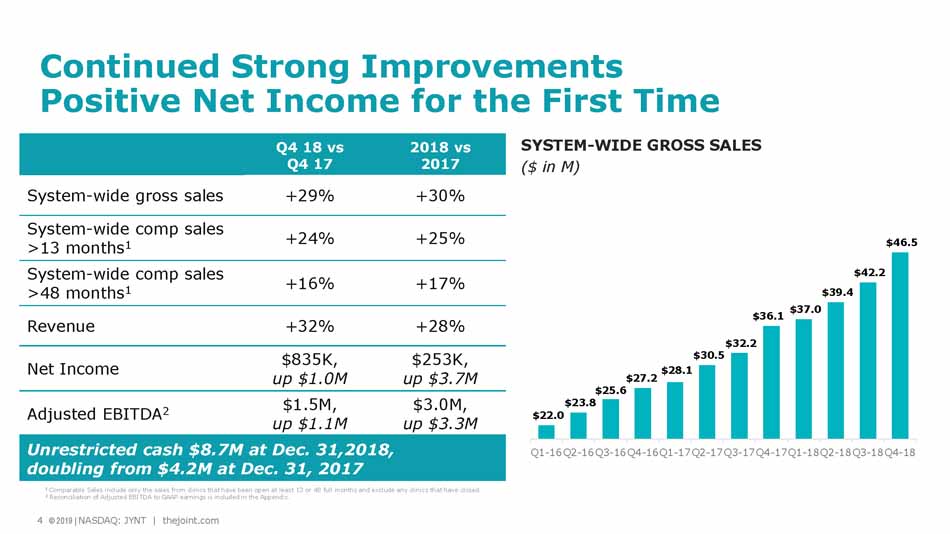
4 © 2019 | NASDAQ: JYNT | thejoint.com Achi Continued Strong Improvements Positive Net Income for the First Time Q4 18 vs Q4 17 2018 vs 2017 System - wide gross sales +29% +30% System - wide comp sales >13 months 1 +24% +25% System - wide comp sales >48 months 1 +16% +17% Revenue +32% +28% Net Income $835K, up $1.0M $253K, up $3.7M Adjusted EBITDA 2 $1.5M, up $1.1M $3.0M, up $3.3M Unrestricted cash $ 8.7M at Dec. 31,2018, doubling from $4.2M at Dec. 31, 2017 1 Comparable Sales include only the sales from clinics that have been open at least 13 or 48 full months and exclude any clinic s t hat have closed. 2 Reconciliation of Adjusted EBITDA to GAAP earnings is included in the Appendix. SYSTEM - WIDE GROSS SALES ($ in M) 4 © 2019 | NASDAQ: JYNT | thejoint.com $22.0 $23.8 $25.6 $27.2 $28.1 $30.5 $32.2 $36.1 $37.0 $39.4 $42.2 $46.5 Q1-16 Q2-16 Q3-16 Q4-16 Q1-17 Q2-17 Q3-17 Q4-17 Q1-18 Q2-18 Q3-18 Q4-18
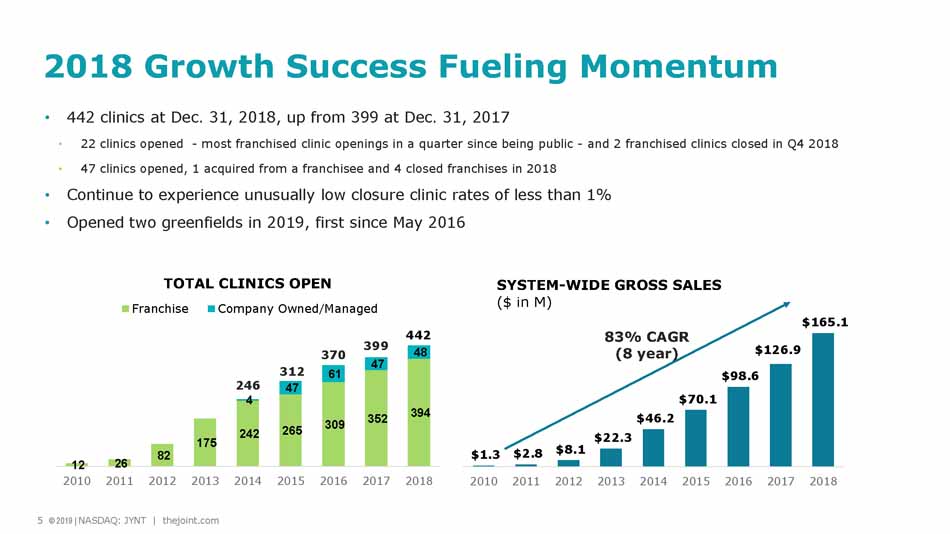
5 © 2019 | NASDAQ: JYNT | thejoint.com Achi • 442 clinics at Dec. 31, 2018, up from 399 at Dec. 31, 2017 • 22 clinics opened - mo st franchised clinic openings in a quarter since being public - and 2 franchised clinics closed in Q4 2018 • 47 clinics opened, 1 acquired from a franchisee and 4 closed franchises in 2018 • Continue to experience unusually low closure clinic rates of less than 1% • Opened two greenfields in 2019, first since May 2016 83% CAGR (8 year) 2018 Growth Success Fueling Momentum 5 © 2019 | NASDAQ: JYNT | thejoint.com 312 370 399 246 12 26 82 175 242 265 309 352 394 4 47 61 47 48 2010 2011 2012 2013 2014 2015 2016 2017 2018 TOTAL CLINICS OPEN Franchise Company Owned/Managed 442 $1.3 $2.8 $8.1 $22.3 $46.2 $70.1 $98.6 $126.9 $165.1 2010 2011 2012 2013 2014 2015 2016 2017 2018 SYSTEM - WIDE GROSS SALES ($ in M)
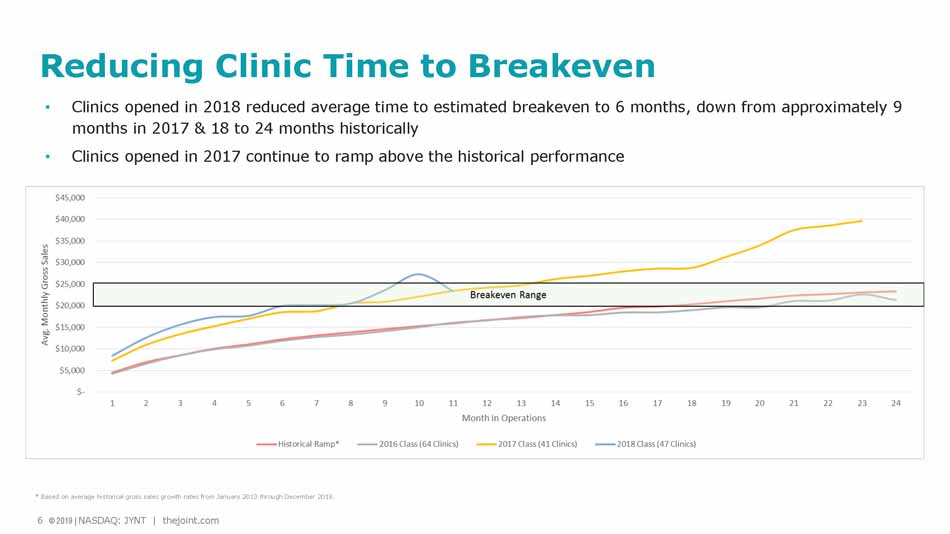
6 © 2019 | NASDAQ: JYNT | thejoint.com Achi Reducing Clinic Time to Breakeven • Clinics opened in 2018 reduced average time to estimated breakeven to 6 months, down from approximately 9 months in 2017 & 18 to 24 months historically • Clinics opened in 2017 continue to ramp above the historical performance * Based on average historical gross sales growth rates from January 2013 through December 2018. 6 © 2019 | NASDAQ: JYNT | thejoint.com
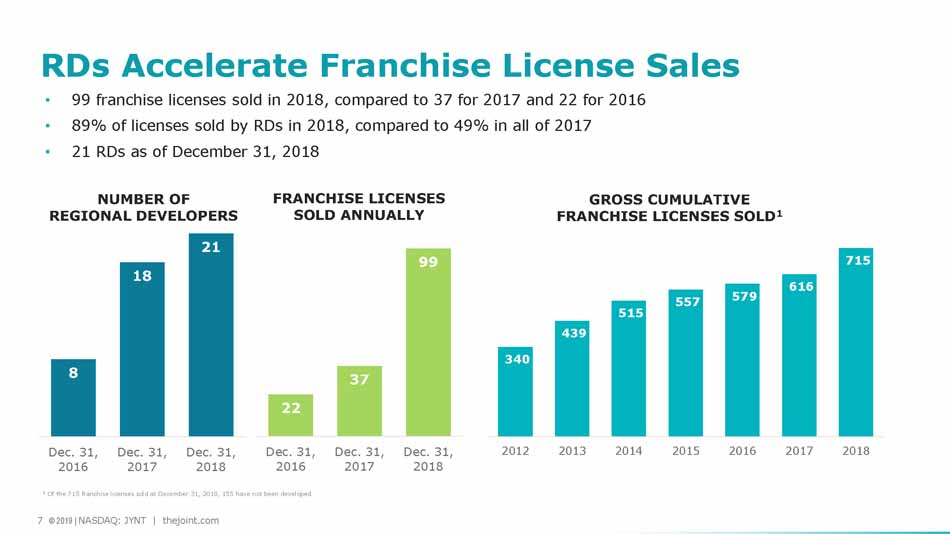
7 © 2019 | NASDAQ: JYNT | thejoint.com Franchise sales through June 2018 were 34, compared to 37 for all of 2017 8 18 21 Dec. 31, 2016 Dec. 31, 2017 Dec. 31, 2018 • 99 franchise licenses sold in 2018, compared to 37 for 2017 and 22 for 2016 • 89% of licenses sold by RDs in 2018, compared to 49% in all of 2017 • 21 RDs as of December 31, 2018 RDs Accelerate Franchise License Sales NUMBER OF REGIONAL DEVELOPERS 7 © 2019 | NASDAQ: JYNT | thejoint.com GROSS CUMULATIVE FRANCHISE LICENSES SOLD 1 1 Of the 715 franchise licenses sold at December 31, 2018, 155 have not been developed. 340 439 515 557 579 616 715 2012 2013 2014 2015 2016 2017 2018 22 37 99 Dec. 31, 2016 Dec. 31, 2017 Dec. 31, 2018 FRANCHISE LICENSES SOLD ANNUALLY
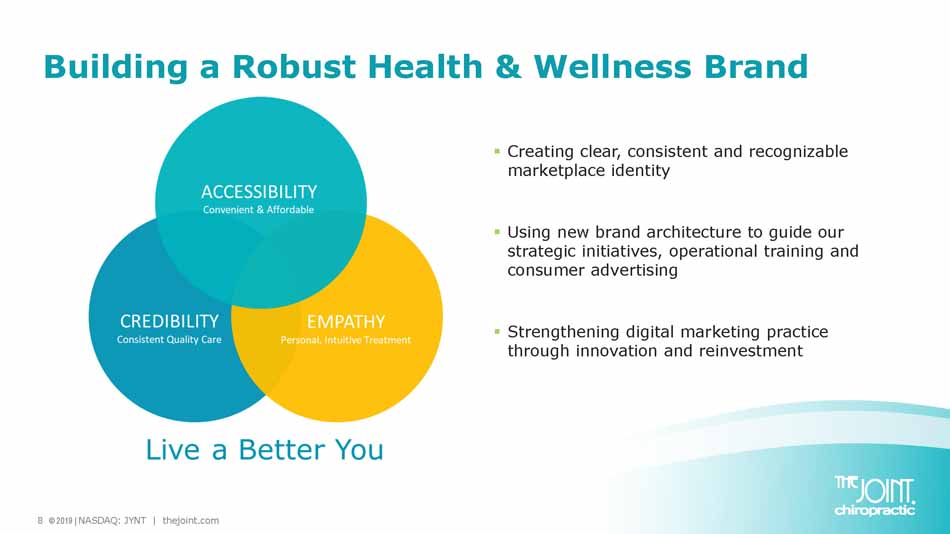
8 © 2019 | NASDAQ: JYNT | thejoint.com Building a Robust Health & Wellness Brand ▪ Creating clear, consistent and recognizable marketplace identity ▪ Using new brand architecture to guide our strategic initiatives, operational training and consumer advertising ▪ Strengthening digital marketing practice through innovation and reinvestment
9 © 2019 | NASDAQ: JYNT | thejoint.com Achi Implementing AXIS, New IT Platform ▪ Licensed SugarCRM ▪ Completed discovery phase ▪ Actively in the design and development phase ▪ On track to complete rollout by end of 2019 Key Customers 9 © 2019 | NASDAQ: JYNT | thejoint.com
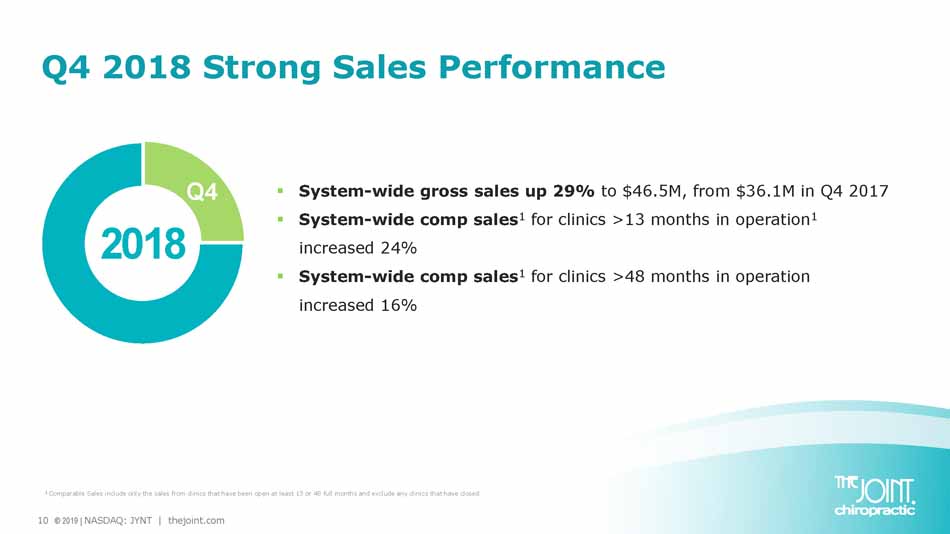
10 © 2019 | NASDAQ: JYNT | thejoint.com Q4 2018 Strong Sales Performance ▪ System - wide gross sales up 29% to $46.5M, from $36.1M in Q4 2017 ▪ System - wide comp sales 1 for clinics >13 months in operation 1 increased 24% ▪ System - wide comp sales 1 for clinics >48 months in operation increased 16% Q4 1 Comparable Sales include only the sales from clinics that have been open at least 13 or 48 full months and exclude any clinic s t hat have closed. 2018 Q4
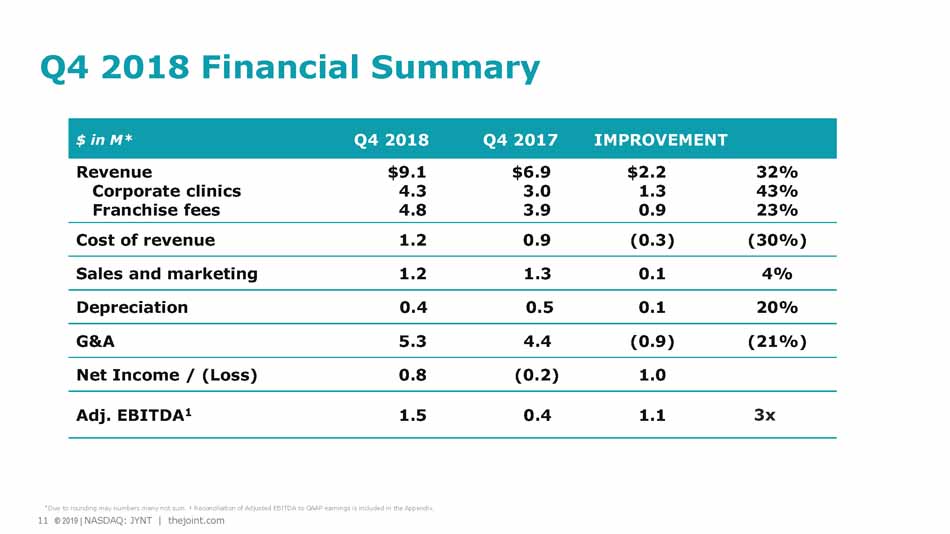
11 © 2019 | NASDAQ: JYNT | thejoint.com Achi $ in M* Q4 2018 Q4 2017 IMPROVEMENT Revenue Corporate clinics Franchise fees $9.1 4.3 4.8 $6.9 3.0 3.9 $2.2 1.3 0.9 32% 43% 23% Cost of revenue 1.2 0.9 (0.3) (30%) Sales and marketing 1.2 1.3 0.1 4% Depreciation 0.4 0.5 0.1 20% G&A 5.3 4.4 (0.9) (21%) Net Income / (Loss) 0.8 (0.2) 1.0 Adj. EBITDA 1 1.5 0.4 1.1 3x Q4 2018 Financial Summary 11 © 2019 | NASDAQ: JYNT | thejoint.com * Due to rounding may numbers many not sum. 1 Reconciliation of Adjusted EBITDA to GAAP earnings is included in the Appendix.
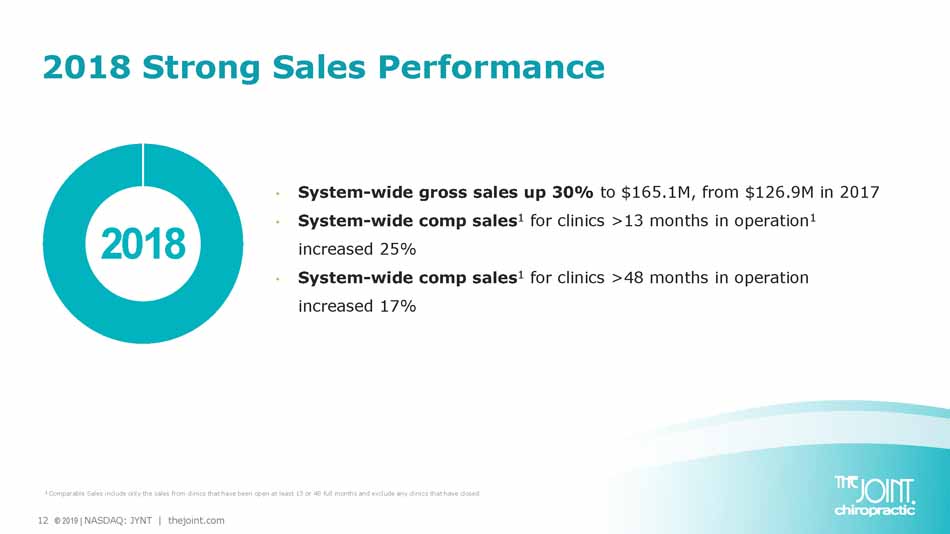
12 © 2019 | NASDAQ: JYNT | thejoint.com 2018 Strong Sales Performance 1 Comparable Sales include only the sales from clinics that have been open at least 13 or 48 full months and exclude any clinic s t hat have closed. • System - wide gross sales up 30% to $165.1M, from $126.9M in 2017 • System - wide comp sales 1 for clinics >13 months in operation 1 increased 25% • System - wide comp sales 1 for clinics >48 months in operation increased 17% 2018
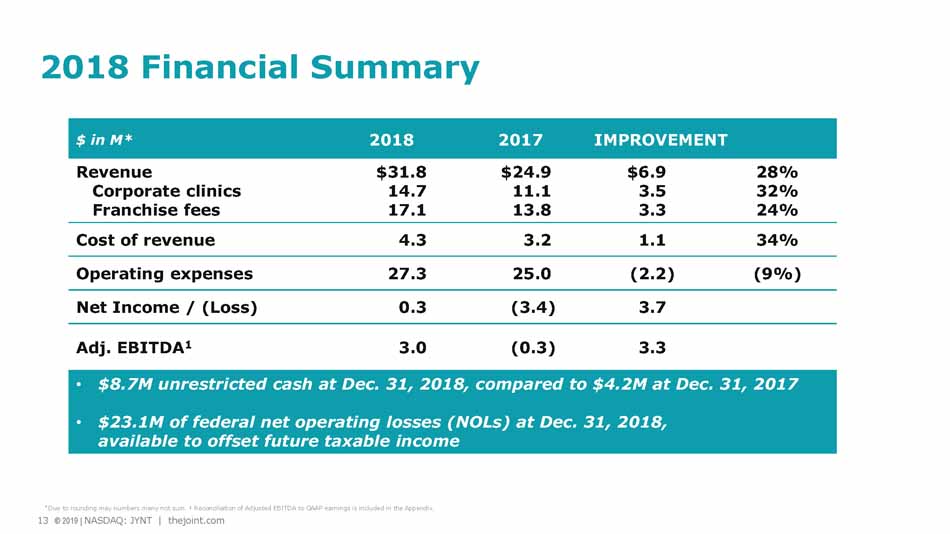
13 © 2019 | NASDAQ: JYNT | thejoint.com Achi $ in M* 2018 2017 IMPROVEMENT Revenue Corporate clinics Franchise fees $31.8 14.7 17.1 $24.9 11.1 13.8 $6.9 3.5 3.3 28% 32% 24% Cost of revenue 4.3 3.2 1.1 34% Operating expenses 27.3 25.0 (2.2) (9%) Net Income / (Loss) 0.3 (3.4) 3.7 Adj. EBITDA 1 3.0 (0.3) 3.3 • $ 8.7M u nrestricted cash at Dec. 31, 2018, compared to $4.2M at Dec. 31, 2017 • $23.1M of federal net operating losses (NOLs) at Dec. 31, 2018, available to offset future taxable income 2018 Financial Summary 13 © 2019 | NASDAQ: JYNT | thejoint.com * Due to rounding may numbers many not sum. 1 Reconciliation of Adjusted EBITDA to GAAP earnings is included in the Appendix.
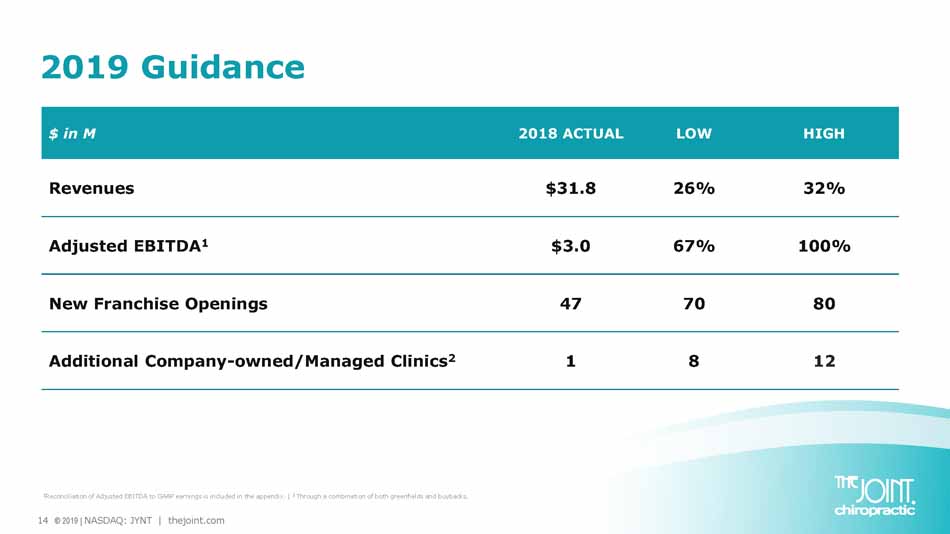
14 © 2019 | NASDAQ: JYNT | thejoint.com $ in M 2018 ACTUAL LOW HIGH Revenues $31.8 26% 32% Adjusted EBITDA 1 $3.0 67% 100% New Franchise Openings 47 70 80 Additional Company - owned/Managed Clinics 2 1 8 12 2019 Guidance 1 Reconciliation of Adjusted EBITDA to GAAP earnings is included in the appendix. | 2 Through a combination of both greenfields and buybacks.

15 © 2019 | NASDAQ: JYNT | thejoint.com Opportunity in Highly Fragmented Market Adults in the U.S. want more options for neck and back pain 3 : ▪ 62% see healthcare professional for neck or back in their lifetime ▪ 25% in the last 12 months ▪ 79% prefer no prescription drugs ▪ 26% of The Joint’s patients new to chiropractic 4 $90B 1 spent on back pain $15B 2 spent on chiropractic care 1 Bureau of Labor Statistics, U.S. Department of Labor, Occupational Outlook Handbook, 2016 - 17 Edition | 2 IBIS World Chiropractors Market Research Report; February 2019 | 3 Gallup - Palmer College of Chiropractic Report 2018 | 4 New patient survey completed February 2019.
16 © 2019 | NASDAQ: JYNT | thejoint.com 2019 Growth Strategy: Continue Momentum ▪ Continue to focus on franchise sales ▪ Further leverage RD strategy ▪ Accelerate the expansion of corporate clinics portfolio within clustered locations • Build greenfield clinics in clustered locations • Acquire franchised clinics opportunistically Building nationwide brand to deliver shareholder value
Non - GAAP Measure Definition This presentation includes a presentation of EBITDA and Adjusted EBITDA, which are non - GAAP financial measures. EBITDA and Adjusted EBITDA are presented because they are important measures used by management to assess financial performance, as management believes they provide a more transparent view of the Company’s underlying operating performance and operating trends. Reconciliations of net loss to EBITDA and Adjusted EBITDA are presented where applicable. The Company defines EBITDA as net income (loss) before net interest, taxes, depreciation and amortization expenses. The Company defines Adjusted EBITDA as EBITDA before acquisition - related expenses, bargain purchase gain, loss on disposition or impairment, and stock - based compensation expenses. EBITDA and Adjusted EBITDA do not represent and should not be considered alternatives to net income or cash flows from operations, as determined by accounting principles generally accepted in the United States, or GAAP. While EBITDA and Adjusted EBITDA are frequently used as measures of financial performance and the ability to meet debt service requirements, they are not necessarily comparable to other similarly titled captions of other companies due to potential inconsistencies in the methods of calculation. EBITDA and Adjusted EBITDA should be reviewed in conjunction with the Company’s financial statements filed with the SEC. 17 © 2019 | NASDAQ: JYNT | thejoint.com
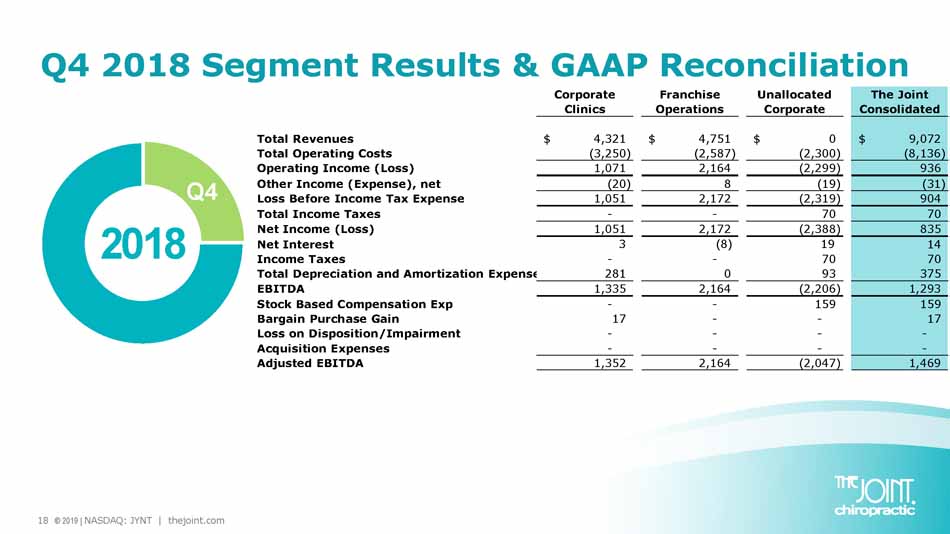
18 © 2019 | NASDAQ: JYNT | thejoint.com Q4 2018 Segment Results & GAAP Reconciliation 2018 Q4 Corporate Clinics Franchise Operations Unallocated Corporate The Joint Consolidated Total Revenues 4,321$ 4,751$ 0$ 9,072$ Total Operating Costs (3,250) (2,587) (2,300) (8,136) Operating Income (Loss) 1,071 2,164 (2,299) 936 Other Income (Expense), net (20) 8 (19) (31) Loss Before Income Tax Expense 1,051 2,172 (2,319) 904 Total Income Taxes - - 70 70 Net Income (Loss) 1,051 2,172 (2,388) 835 Net Interest 3 (8) 19 14 Income Taxes - - 70 70 Total Depreciation and Amortization Expense 281 0 93 375 EBITDA 1,335 2,164 (2,206) 1,293 Stock Based Compensation Exp - - 159 159 Bargain Purchase Gain 17 - - 17 Loss on Disposition/Impairment - - - - Acquisition Expenses - - - - Adjusted EBITDA 1,352 2,164 (2,047) 1,469
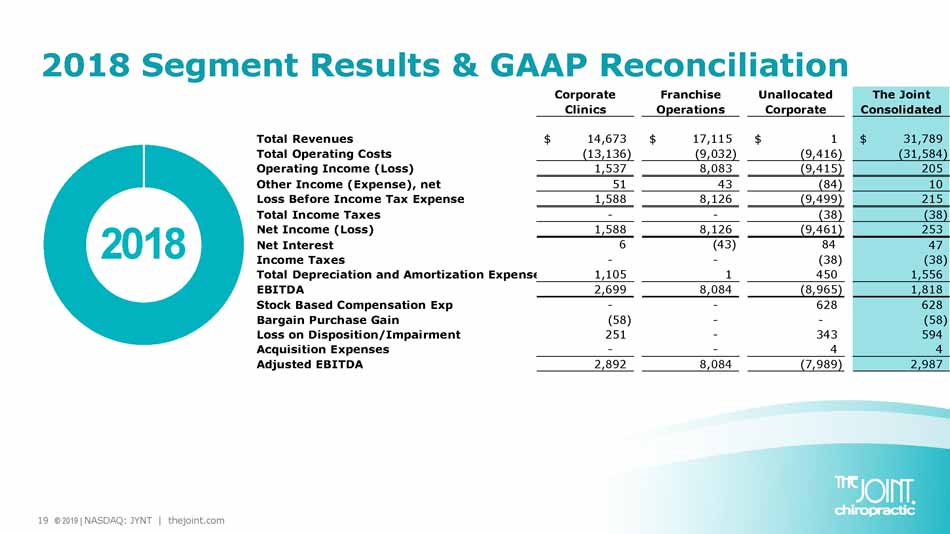
19 © 2019 | NASDAQ: JYNT | thejoint.com 2018 Segment Results & GAAP Reconciliation 2018 Corporate Clinics Franchise Operations Unallocated Corporate The Joint Consolidated Total Revenues 14,673$ 17,115$ 1$ 31,789$ Total Operating Costs (13,136) (9,032) (9,416) (31,584) Operating Income (Loss) 1,537 8,083 (9,415) 205 Other Income (Expense), net 51 43 (84) 10 Loss Before Income Tax Expense 1,588 8,126 (9,499) 215 Total Income Taxes - - (38) (38) Net Income (Loss) 1,588 8,126 (9,461) 253 Net Interest 6 (43) 84 47 Income Taxes - - (38) (38) Total Depreciation and Amortization Expense 1,105 1 450 1,556 EBITDA 2,699 8,084 (8,965) 1,818 Stock Based Compensation Exp - - 628 628 Bargain Purchase Gain (58) - - (58) Loss on Disposition/Impairment 251 - 343 594 Acquisition Expenses - - 4 4 Adjusted EBITDA 2,892 8,084 (7,989) 2,987
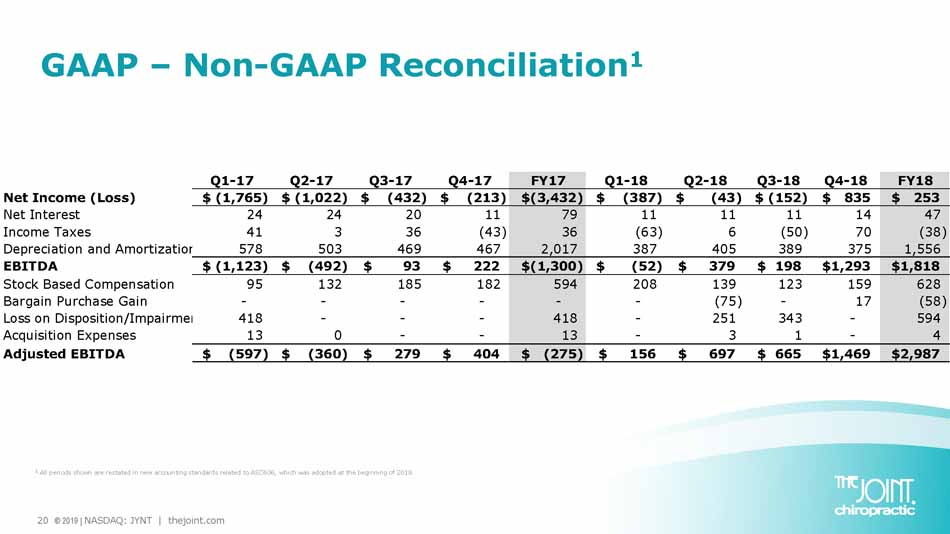
20 © 2019 | NASDAQ: JYNT | thejoint.com GAAP – Non - GAAP Reconciliation 1 1 All periods shown are restated in new accounting standards related to ASC606, which was adopted at the beginning of 2018. Q1-17 Q2-17 Q3-17 Q4-17 FY17 Q1-18 Q2-18 Q3-18 Q4-18 FY18 Net Income (Loss) (1,765)$ (1,022)$ (432)$ (213)$ (3,432)$ (387)$ (43)$ (152)$ 835$ 253$ Net Interest 24 24 20 11 79 11 11 11 14 47 Income Taxes 41 3 36 (43) 36 (63) 6 (50) 70 (38) Depreciation and Amortization Expense578 503 469 467 2,017 387 405 389 375 1,556 EBITDA (1,123)$ (492)$ 93$ 222$ (1,300)$ (52)$ 379$ 198$ 1,293$ 1,818$ Stock Based Compensation 95 132 185 182 594 208 139 123 159 628 Bargain Purchase Gain - - - - - - (75) - 17 (58) Loss on Disposition/Impairment 418 - - - 418 - 251 343 - 594 Acquisition Expenses 13 0 - - 13 - 3 1 - 4 Adjusted EBITDA (597)$ (360)$ 279$ 404$ (275)$ 156$ 697$ 665$ 1,469$ 2,987$

21 © 2019 | NASDAQ: JYNT | thejoint.com Peter D. Holt, President and CEO peter.holt@thejoint.com Jake Singleton, CFO jake.singleton@thejoint.com Kirsten Chapman, LHA Investor Relations thejoint@lhai.com The Joint Corp. Contact Information https://www.facebook.com/thejointchiro @ thejointchiro https://twitter.com/thejointchiro @ thejointchiro https://www.youtube.com/thejointcorp @ thejointcorp The Joint Corp. | 16767 N. Perimeter Dr., Suite 240 | Scottsdale, AZ 85260 | (480) 245 - 5960