
Exhibit 99.3
REVOLUTIONIZING ACCESS TO CHIROPRACTIC CARE THE JOINT CORP. | NASDAQ: JYNT | thejoint.com Q3 2018 FINANCIAL RESULTS AS OF SEPTEMBER 30, 2018 REPORTED NOVEMBER 8, 2018
Safe Harbor Statement Certain statements contained in this presentation are "forward - looking statements." We have tried to identify these forward - look ing statements by using words such as "may," "might," " will," "expect,” "anticipate,'' "'believe,“ "could," " intend," "plan," "estimate," "should," "if,“ "project," and similar expressio ns. All statements other than statements of historical facts contained in this presentation, including statements regarding our growth strategies, our vision, future operations, future financial posi tio n, future revenue, projected costs, prospects, plans, objectives of management and expected market growth and potential are forward - looking statements. We have based these forward - looking statemen ts on our current expectations and projections about future events. However, these forward - looking statements are subject to risks, uncertainties, assumptions and other factors that may cause our actual results, performance or achievements to be materially different from our expectations and projections. Some of these risks, uncertainties and other factors are set f ort h in this presentation and in other documents we file with the United States Securities and Exchange Commission (the "SEC"). Given these risks and uncertainties, readers are cautioned not to place undue reliance on our forward - looking statements. Projec tions and other forward - looking statements included in this presentation have been prepared based on assumptions, which we believe to be reasonable, but not in accordance with U.S. Gene ral ly Accepted Accounting Principals (“GAAP”) or any guidelines of the SEC. Actual results may vary, perhaps materially. You are strongly cautioned not to place undue reliance on su ch projections and other forward - looking statements. All subsequent written and oral forward - looking statements attributable us or to persons acting on our behalf are expressly qualifie d in their entirety by these cautionary statements. Except as required by federal securities laws, we disclaim any intention or obligation to update or revise any forward - looking statements, whether as a result of new information, future events or otherwise. Any such forward - looking statements, whether made in this presentation or elsewhere, should be considered in the cont ext of the various disclosures made by us about our businesses including, without limitation, the risk factors discussed above. In addition to results presented in accordance with U.S. GAAP, this presentation includes a presentation of EBITDA and Adjust ed EBITDA, which are non - GAAP financial measures. EBITDA and Adjusted EBITDA are presented because they are important measures used by management to assess financial performance, as mana gem ent believes they provide a more transparent view of the Company’s underlying operating performance and operating trends. Reconciliations of net loss to EBITDA and Adjusted EBITD A a re presented where applicable. We define EBITDA as net income (loss) before net interest, taxes, depreciation and amortization expenses. We define Adjusted EBITDA as EBITDA before acq uisition - related expenses, bargain purchase gain, loss on disposition or impairment, and stock - based compensation expenses. EBITDA and Adjusted EBITDA do not represent and should not be considered alternatives to net income or cash flows from operat ion s, as determined by GAAP. While EBITDA and Adjusted EBITDA are frequently used as measures of financial performance and the ability to meet debt service requirements, they are n ot necessarily comparable to other similarly titled captions of other companies due to potential inconsistencies in the methods of calculation. EBITDA and Adjusted EBITDA should be reviewed in conjunction with our financial statements filed with the SEC. Business Structure The Joint Corp. is a franchisor of clinics and an operator of clinics in certain states. In Arkansas, California, Colorado, Florida, Illinois, Kansas, Minnesota, New Jersey, New York, North Carolina, Oregon, Pennsylvania, and Tennessee, The Joint Corp. and its franchisees provide management services to affiliated professional chiropractic practices. 2 © 2018 | NASDAQ: JYNT | thejoint.com
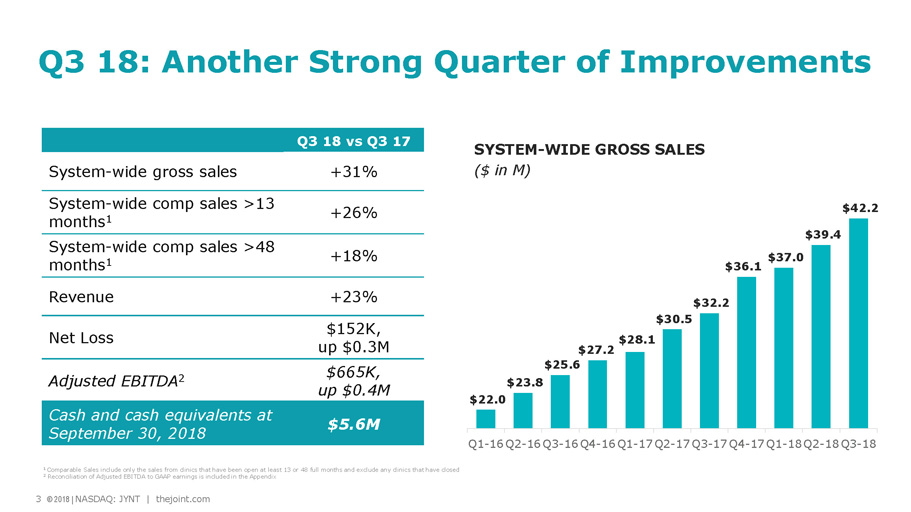
3 © 2018 | NASDAQ: JYNT | thejoint.com Achi Q3 18: Another Strong Quarter of Improvements Q3 18 vs Q3 17 System - wide gross sales +31% System - wide comp sales >13 months 1 +26% System - wide comp sales >48 months 1 +18% Revenue +23% Net Loss $152K, up $0.3M Adjusted EBITDA 2 $665K, up $0.4M Cash and cash equivalents at September 30, 2018 $5.6M 1 Comparable Sales include only the sales from clinics that have been open at least 13 or 48 full months and exclude any clinic s t hat have closed 2 Reconciliation of Adjusted EBITDA to GAAP earnings is included in the Appendix SYSTEM - WIDE GROSS SALES ($ in M) 3 © 2018 | NASDAQ: JYNT | thejoint.com $22.0 $23.8 $25.6 $27.2 $28.1 $30.5 $32.2 $36.1 $37.0 $39.4 $42.2 Q1-16 Q2-16 Q3-16 Q4-16 Q1-17 Q2-17 Q3-17 Q4-17 Q1-18 Q2-18 Q3-18
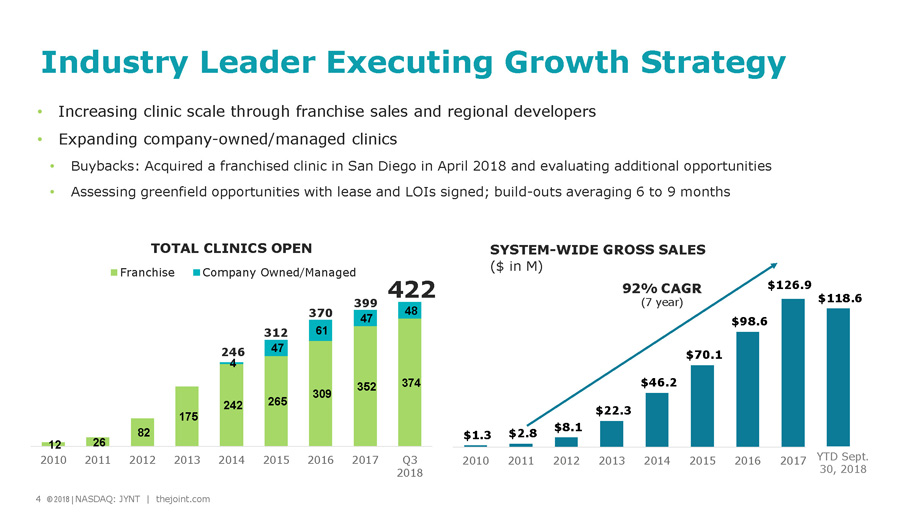
4 © 2018 | NASDAQ: JYNT | thejoint.com Achi 12 26 82 175 242 265 309 352 374 4 47 61 47 48 2010 2011 2012 2013 2014 2015 2016 2017 Q3 2018 TOTAL CLINICS OPEN Franchise Company Owned/Managed • Increasing clinic scale through franchise sales and regional developers • Expanding company - owned/managed clinics • Buybacks: Acquired a franchised clinic in San Diego in April 2018 and evaluating additional opportunities • Assessing greenfield opportunities with lease and LOIs signed; build - outs averaging 6 to 9 months $1.3 $2.8 $8.1 $22.3 $46.2 $70.1 $98.6 $126.9 $118.6 2010 2011 2012 2013 2014 2015 2016 2017 Q3 2018 SYSTEM - WIDE GROSS SALES ($ in M) 92% CAGR (7 year) Industry Leader Executing Growth Strategy 4 © 2018 | NASDAQ: JYNT | thejoint.com 312 370 422 399 246 YTD Sept. 30, 2018
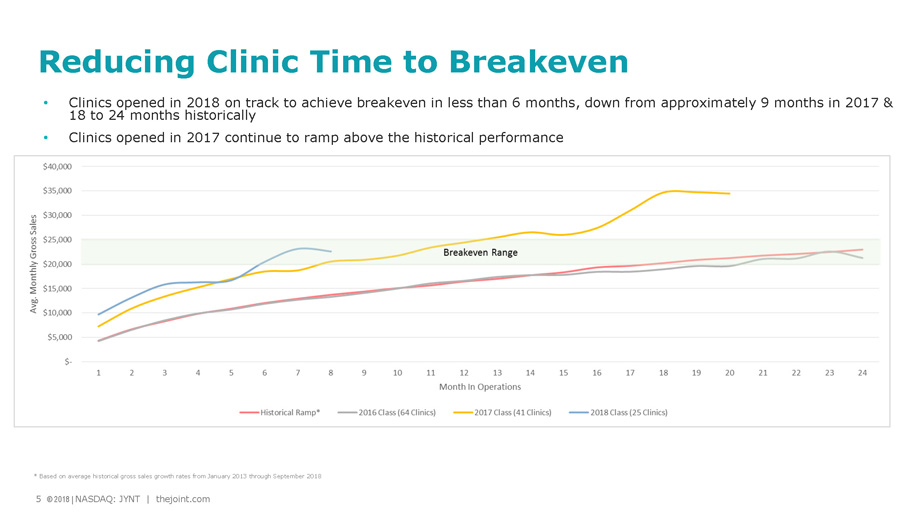
5 © 2018 | NASDAQ: JYNT | thejoint.com Achi Reducing Clinic Time to Breakeven • Clinics opened in 2018 on track to achieve breakeven in less than 6 months, down from approximately 9 months in 2017 & 18 to 24 months historically • Clinics opened in 2017 continue to ramp above the historical performance * Based on average historical gross sales growth rates from January 2013 through September 2018 5 © 2018 | NASDAQ: JYNT | thejoint.com
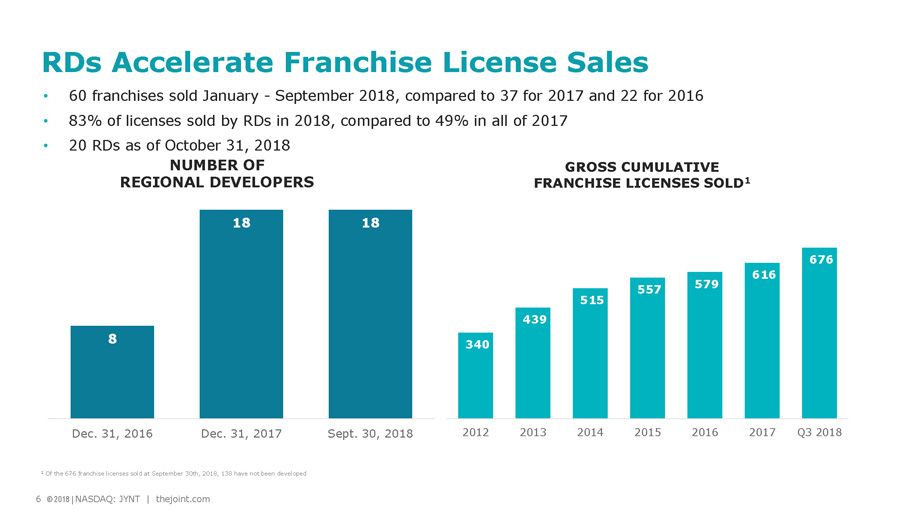
6 © 2018 | NASDAQ: JYNT | thejoint.com Franchise sales through June 2018 were 34, compared to 37 for all of 2017 • 60 franchises sold January - September 2018, compared to 37 for 2017 and 22 for 2016 • 83% of licenses sold by RDs in 2018, compared to 49% in all of 2017 • 20 RDs as of October 31, 2018 RDs Accelerate Franchise License Sales NUMBER OF REGIONAL DEVELOPERS 6 © 2018 | NASDAQ: JYNT | thejoint.com GROSS CUMULATIVE FRANCHISE LICENSES SOLD 1 1 Of the 676 franchise licenses sold at September 30th, 2018, 138 have not been developed 340 439 515 557 579 616 676 2012 2013 2014 2015 2016 2017 Q3 2018 8 18 18 Dec. 31, 2016 Dec. 31, 2017 Sept. 30, 2018
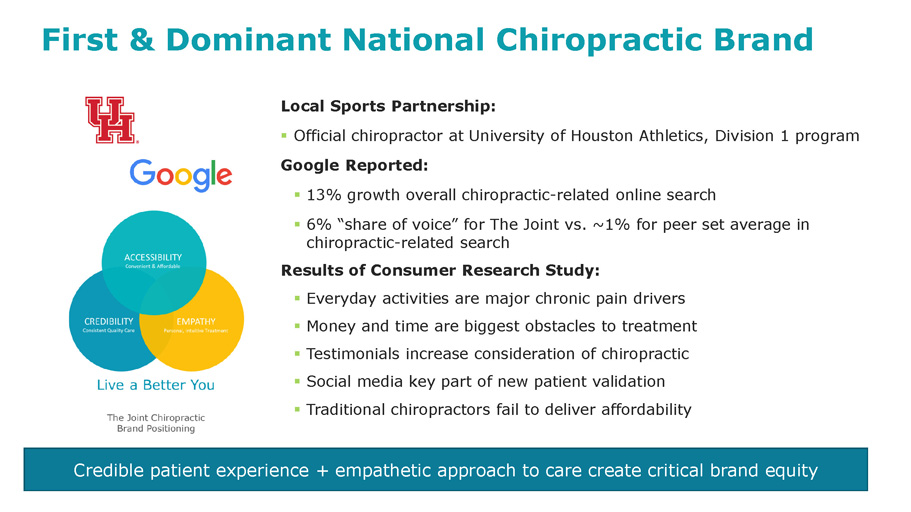
7 © 2018 | NASDAQ: JYNT | thejoint.com Achi First & Dominant National Chiropractic Brand Credible patient experience + empathetic approach to care create critical brand equity Local Sports Partnership: ▪ Official chiropractor at University of Houston Athletics, Division 1 program Google Reported: ▪ 13% growth overall chiropractic - related online search ▪ 6% “share of voice” for The Joint vs. ~1% for peer set average in chiropractic - related search Results of Consumer Research Study: ▪ Everyday activities are major chronic pain drivers ▪ Money and time are biggest obstacles to treatment ▪ Testimonials increase consideration of chiropractic ▪ Social media key part of new patient validation ▪ Traditional chiropractors fail to deliver affordability
8 © 2018 | NASDAQ: JYNT | thejoint.com Achi Implementing New IT Platform ▪ Evaluated IT options ▪ The Joint approaching critical mass ▪ Third - party SaaS CRM costs decreased ▪ Cyber - security risks increased ▪ Licensed SugarCRM ▪ Completed discovery phase ▪ Expect complete rollout by end of 2019 ▪ Recognized $343K non - cash write - off of previously capitalized in - house IT development Key Customers
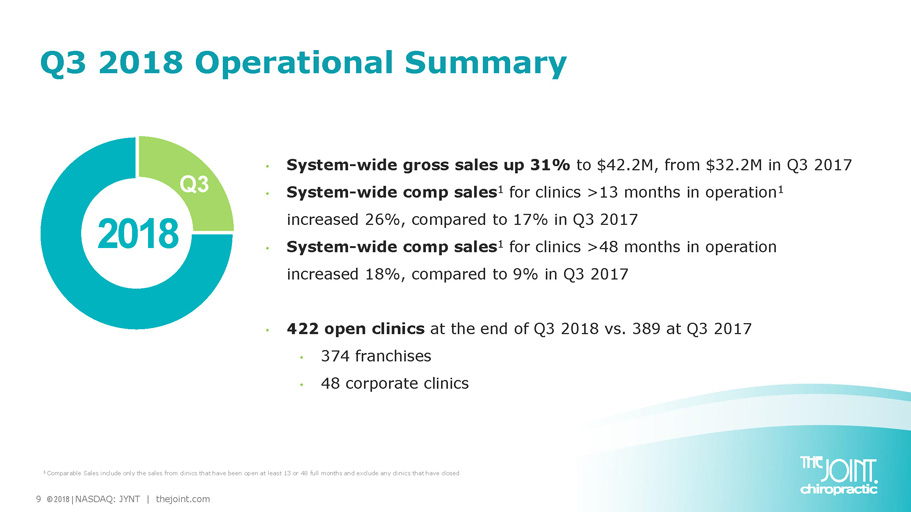
9 © 2018 | NASDAQ: JYNT | thejoint.com Q3 2018 Operational Summary • System - wide gross sales up 31% to $42.2M, from $32.2M in Q3 2017 • System - wide comp sales 1 for clinics >13 months in operation 1 increased 26%, compared to 17% in Q3 2017 • System - wide comp sales 1 for clinics >48 months in operation increased 18%, compared to 9% in Q3 2017 • 422 open clinics at the end of Q3 2018 vs. 389 at Q3 2017 • 374 franchises • 48 corporate clinics 2018 Q3 1 Comparable Sales include only the sales from clinics that have been open at least 13 or 48 full months and exclude any clinic s t hat have closed
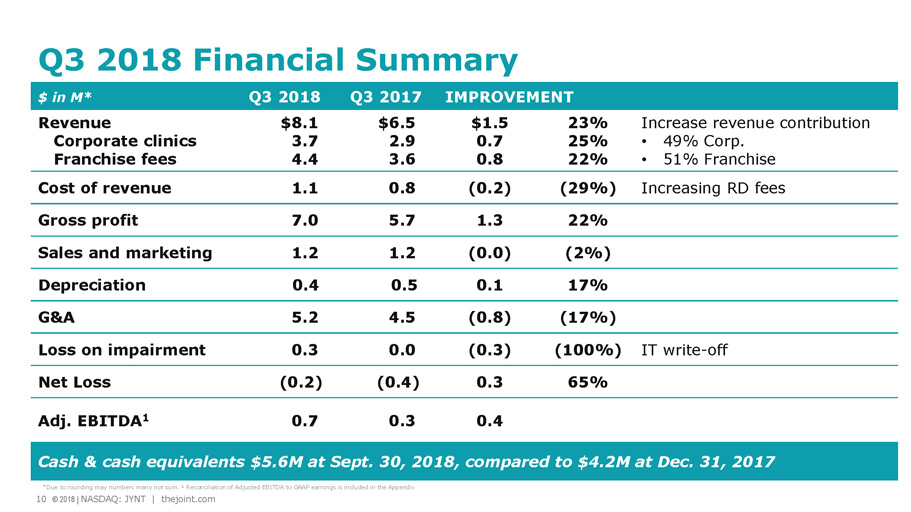
10 © 2018 | NASDAQ: JYNT | thejoint.com Achi $ in M* Q3 2018 Q3 2017 IMPROVEMENT Revenue Corporate clinics Franchise fees $8.1 3.7 4.4 $6.5 2.9 3.6 $1.5 0.7 0.8 23% 25% 22% Increase revenue contribution • 49% Corp. • 51% Franchise Cost of revenue 1.1 0.8 (0.2) (29%) Increasing RD fees Gross profit 7.0 5.7 1.3 22% Sales and marketing 1.2 1.2 (0.0) (2%) Depreciation 0.4 0.5 0.1 17% G&A 5.2 4.5 (0.8) (17%) Loss on impairment 0.3 0.0 (0.3) (100%) IT write - off Net Loss (0.2) (0.4) 0.3 65% Adj. EBITDA 1 0.7 0.3 0.4 Cash & cash equivalents $ 5.6M at Sept. 30, 2018, compared to $4.2M at Dec. 31, 2017 Q3 2018 Financial Summary 10 © 2018 | NASDAQ: JYNT | thejoint.com * Due to rounding may numbers many not sum. 1 Reconciliation of Adjusted EBITDA to GAAP earnings is included in the Appendix
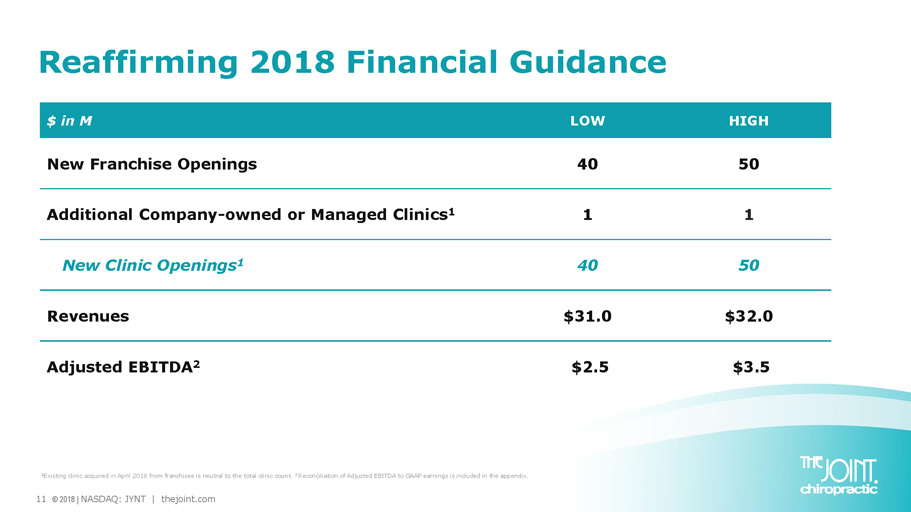
11 © 2018 | NASDAQ: JYNT | thejoint.com $ in M LOW HIGH New Franchise Openings 40 50 Additional Company - owned or Managed Clinics 1 1 1 New Clinic Openings 1 40 50 Revenues $31.0 $32.0 Adjusted EBITDA 2 $2.5 $3.5 Reaffirming 2018 Financial Guidance 1 Existing clinic acquired in April 2018 from franchisee is neutral to the total clinic count. 2 Reconciliation of Adjusted EBITDA to GAAP earnings is included in the appendix.

12 © 2018 | NASDAQ: JYNT | thejoint.com Opportunity in Highly Fragmented Market Adults in the U.S. want more options for neck and back pain 3 : ▪ 67% see healthcare professional for neck or back in their lifetime ▪ 25% in the last 12 months ▪ 79% prefer no prescription drugs ▪ 22% of The Joint’s 2017 patients new to chiropractic $90B 1 spent on back pain $16B 2 spent on chiropractic care 1 Bureau of Labor Statistics, U.S. Department of Labor, Occupational Outlook Handbook, 2016 - 17 Edition | 2 IBIS World Chiropractors Market Research Report; August 2018 | 3 Gallup - Palmer College of Chiropractic Report 2018
13 © 2018 | NASDAQ: JYNT | thejoint.com 2018 Growth Strategy: Driving Scale • Accelerate franchise sales • Leverage Regional Developers • Reengage growth of company owned/managed units • Acquire franchised clinics opportunistically • Build greenfield clinics in clustered locations Building nationwide brand to deliver shareholder value
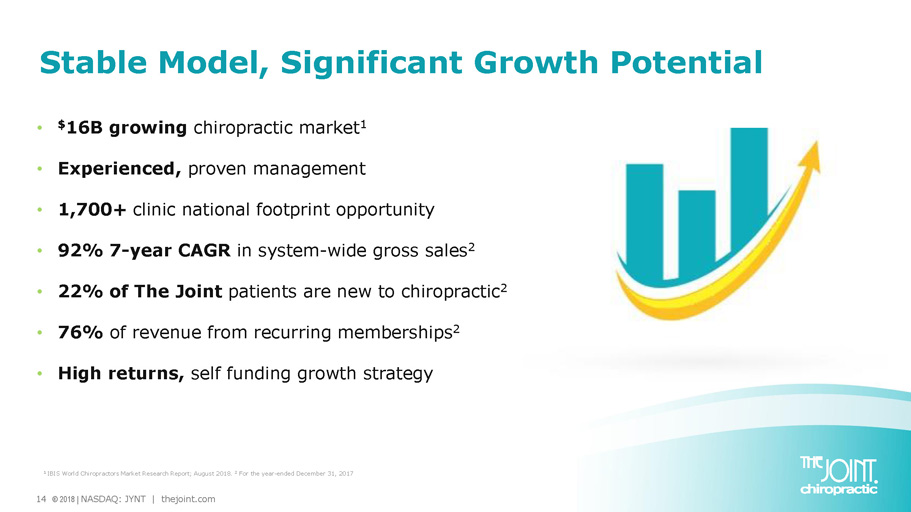
14 © 2018 | NASDAQ: JYNT | thejoint.com Stable Model, Significant Growth Potential 1 IBIS World Chiropractors Market Research Report; August 2018. 2 For the year - ended December 31, 2017 • $ 16B growing chiropractic market 1 • Experienced, proven management • 1,700+ clinic national footprint opportunity • 92% 7 - year CAGR in system - wide gross sales 2 • 22% of The Joint patients are new to chiropractic 2 • 76% of revenue from recurring memberships 2 • High returns, self funding growth strategy
Non - GAAP Measure Definition This presentation includes a presentation of EBITDA and Adjusted EBITDA, which are non - GAAP financial measures. EBITDA and Adjusted EBITDA are presented because they are important measures used by management to assess financial performance, as management believes they provide a more transparent view of the Company’s underlying operating performance and operating trends. Reconciliations of net loss to EBITDA and Adjusted EBITDA are presented where applicable. The Company defines EBITDA as net income (loss) before net interest, taxes, depreciation and amortization expenses. The Company defines Adjusted EBITDA as EBITDA before acquisition - related expenses, bargain purchase gain, loss on disposition or impairment, and stock - based compensation expenses. EBITDA and Adjusted EBITDA do not represent and should not be considered alternatives to net income or cash flows from operations, as determined by accounting principles generally accepted in the United States, or GAAP. While EBITDA and Adjusted EBITDA are frequently used as measures of financial performance and the ability to meet debt service requirements, they are not necessarily comparable to other similarly titled captions of other companies due to potential inconsistencies in the methods of calculation. EBITDA and Adjusted EBITDA should be reviewed in conjunction with the Company’s financial statements filed with the SEC. 15 © 2018 | NASDAQ: JYNT | thejoint.com
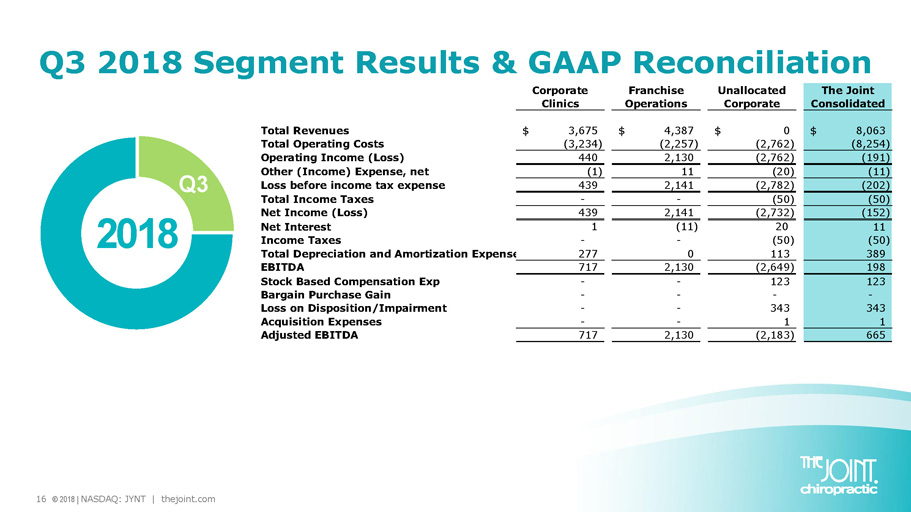
16 © 2018 | NASDAQ: JYNT | thejoint.com Q3 2018 Segment Results & GAAP Reconciliation 2018 Q3 Corporate Clinics Franchise Operations Unallocated Corporate The Joint Consolidated Total Revenues 3,675$ 4,387$ 0$ 8,063$ Total Operating Costs (3,234) (2,257) (2,762) (8,254) Operating Income (Loss) 440 2,130 (2,762) (191) Other (Income) Expense, net (1) 11 (20) (11) Loss before income tax expense 439 2,141 (2,782) (202) Total Income Taxes - - (50) (50) Net Income (Loss) 439 2,141 (2,732) (152) Net Interest 1 (11) 20 11 Income Taxes - - (50) (50) Total Depreciation and Amortization Expense 277 0 113 389 EBITDA 717 2,130 (2,649) 198 Stock Based Compensation Exp - - 123 123 Bargain Purchase Gain - - - - Loss on Disposition/Impairment - - 343 343 Acquisition Expenses - - 1 1 Adjusted EBITDA 717 2,130 (2,183) 665
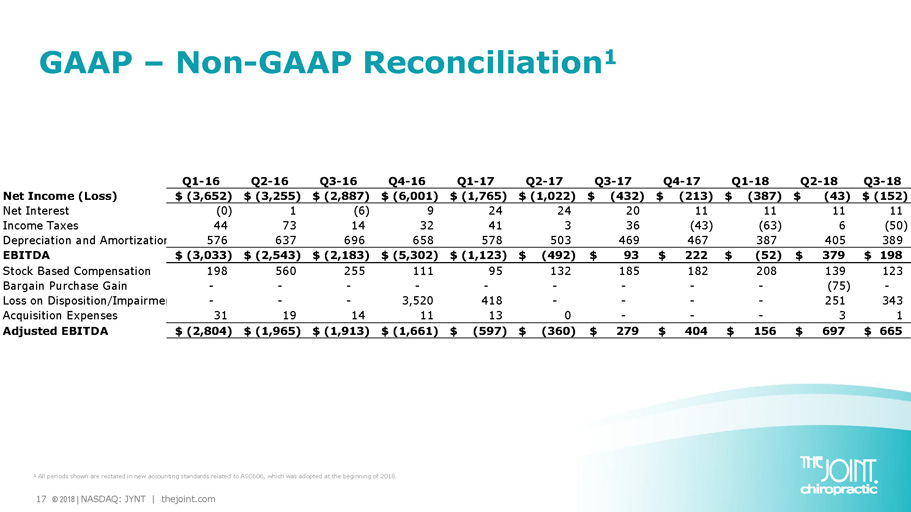
17 © 2018 | NASDAQ: JYNT | thejoint.com GAAP – Non - GAAP Reconciliation 1 1 All periods shown are restated in new accounting standards related to ASC606, which was adopted at the beginning of 2018. Q1-16 Q2-16 Q3-16 Q4-16 Q1-17 Q2-17 Q3-17 Q4-17 Q1-18 Q2-18 Q3-18 Net Income (Loss) (3,652)$ (3,255)$ (2,887)$ (6,001)$ (1,765)$ (1,022)$ (432)$ (213)$ (387)$ (43)$ (152)$ Net Interest (0) 1 (6) 9 24 24 20 11 11 11 11 Income Taxes 44 73 14 32 41 3 36 (43) (63) 6 (50) Depreciation and Amortization Expense576 637 696 658 578 503 469 467 387 405 389 EBITDA (3,033)$ (2,543)$ (2,183)$ (5,302)$ (1,123)$ (492)$ 93$ 222$ (52)$ 379$ 198$ Stock Based Compensation 198 560 255 111 95 132 185 182 208 139 123 Bargain Purchase Gain - - - - - - - - - (75) - Loss on Disposition/Impairment - - - 3,520 418 - - - - 251 343 Acquisition Expenses 31 19 14 11 13 0 - - - 3 1 Adjusted EBITDA (2,804)$ (1,965)$ (1,913)$ (1,661)$ (597)$ (360)$ 279$ 404$ 156$ 697$ 665$

18 © 2018 | NASDAQ: JYNT | thejoint.com Peter D. Holt, President and CEO peter.holt@thejoint.com Jake Singleton, CFO jake.singleton@thejoint.com Kirsten Chapman, LHA Investor Relations thejoint@lhai.com The Joint Corp. Contact Information https://www.facebook.com/thejointchiro @ thejointchiro https://twitter.com/thejointchiro @ thejointchiro https://www.youtube.com/thejointcorp @ thejointcorp The Joint Corp. | 16767 N. Perimeter Dr., Suite 240 | Scottsdale, AZ 85260 | (480) 245 - 5960