
Exhibit 99.2
REINVENTING CHIROPRACTIC CARE THE JOINT CORP. | NASDAQ: JYNT | thejoint.com Q2 2018 FINANCIAL RESULTS AS OF AUGUST 9, 2018

Safe Harbor Statement Certain statements contained in this presentation are "forward - looking statements." We have tried to identify these forward - look ing statements by using words such as "may," "might," " will," "expect,” "anticipate,'' "'believe,“ "could," " intend," "plan," "estimate," "should," "if,“ "project," and similar expressio ns. All statements other than statements of historical facts contained in this presentation, including statements regarding our growth strategies, our vision, future operations, future financial posi tio n, future revenue, projected costs, prospects, plans, objectives of management and expected market growth and potential are forward - looking statements. We have based these forward - looking statemen ts on our current expectations and projections about future events. However, these forward - looking statements are subject to risks, uncertainties, assumptions and other factors that may cause our actual results, performance or achievements to be materially different from our expectations and projections. Some of these risks, uncertainties and other factors are set f ort h in this presentation and in other documents we file with the United States Securities and Exchange Commission (the "SEC"). Given these risks and uncertainties, readers are cautioned not to place undue reliance on our forward - looking statements. Projec tions and other forward - looking statements included in this presentation have been prepared based on assumptions, which we believe to be reasonable, but not in accordance with U.S. Gene ral ly Accepted Accounting Principals (“GAAP”) or any guidelines of the SEC. Actual results may vary, perhaps materially. You are strongly cautioned not to place undue reliance on su ch projections and other forward - looking statements. All subsequent written and oral forward - looking statements attributable us or to persons acting on our behalf are expressly qualifie d in their entirety by these cautionary statements. Except as required by federal securities laws, we disclaim any intention or obligation to update or revise any forward - looking statements, whether as a result of new information, future events or otherwise. Any such forward - looking statements, whether made in this presentation or elsewhere, should be considered in the cont ext of the various disclosures made by us about our businesses including, without limitation, the risk factors discussed above. In addition to results presented in accordance with U.S. GAAP, this presentation includes a presentation of EBITDA and Adjust ed EBITDA, which are non - GAAP financial measures. EBITDA and Adjusted EBITDA are presented because they are important measures used by management to assess financial performance, as mana gem ent believes they provide a more transparent view of the Company’s underlying operating performance and operating trends. Reconciliations of net loss to EBITDA and Adjusted EBITD A a re presented where applicable. We define EBITDA as net income (loss) before net interest, taxes, depreciation and amortization expenses. We define Adjusted EBITDA as EBITDA before acq uisition - related expenses, bargain purchase gain, loss on disposition or impairment, and stock - based compensation expenses. EBITDA and Adjusted EBITDA do not represent and should not be considered alternatives to net income or cash flows from operat ion s, as determined by GAAP. While EBITDA and Adjusted EBITDA are frequently used as measures of financial performance and the ability to meet debt service requirements, they are n ot necessarily comparable to other similarly titled captions of other companies due to potential inconsistencies in the methods of calculation. EBITDA and Adjusted EBITDA should be reviewed in conjunction with our financial statements filed with the SEC. Business Structure The Joint Corp. is a franchisor of clinics and an operator of clinics in certain states. In Arkansas, California, Colorado, Florida, Illinois, Kansas, Minnesota, New Jersey, New York, North Carolina, Oregon, Pennsylvania, and Tennessee, The Joint Corp. and its franchisees provide management services to affiliated professional chiropractic practices. 2 © 2018 | NASDAQ: JYNT | thejoint.com
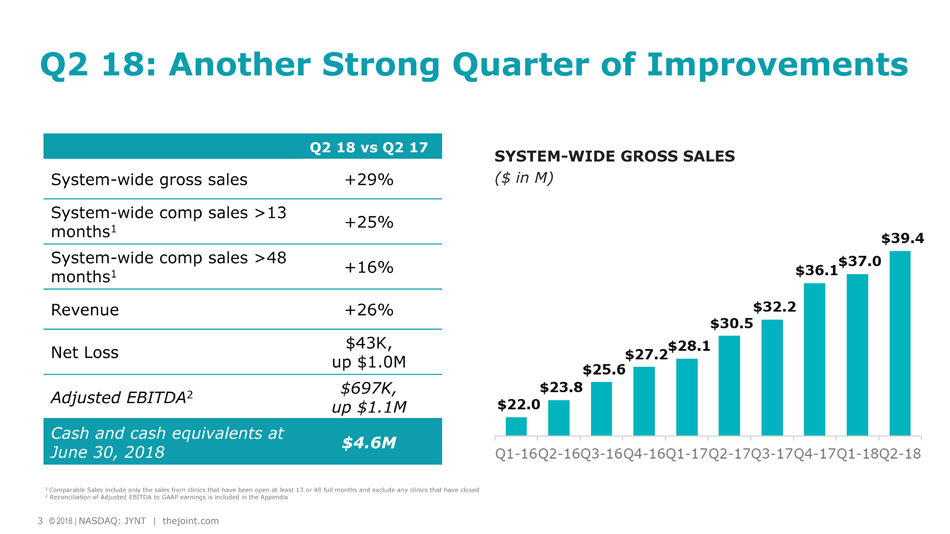
3 © 2018 | NASDAQ: JYNT | thejoint.com Achi Q2 18: Another Strong Quarter of Improvements Q2 18 vs Q2 17 System - wide gross sales +29% System - wide comp sales >13 months 1 +25% System - wide comp sales >48 months 1 +16% Revenue +26% Net Loss $43K, up $1.0M Adjusted EBITDA 2 $697K, up $1.1M Cash and cash equivalents at June 30, 2018 $4.6M 1 Comparable Sales include only the sales from clinics that have been open at least 13 or 48 full months and exclude any clinic s t hat have closed 2 Reconciliation of Adjusted EBITDA to GAAP earnings is included in the Appendix SYSTEM - WIDE GROSS SALES ($ in M) 3 © 2018 | NASDAQ: JYNT | thejoint.com
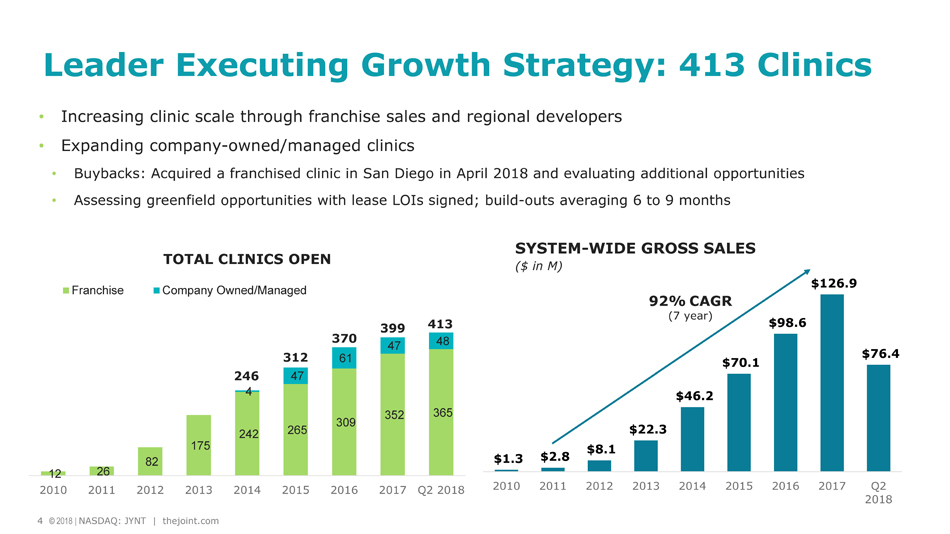
4 © 2018 | NASDAQ: JYNT | thejoint.com Achi 12 26 82 175 242 265 309 352 365 4 47 61 47 48 2010 2011 2012 2013 2014 2015 2016 2017 Q2 2018 TOTAL CLINICS OPEN Franchise Company Owned/Managed • Increasing clinic scale through franchise sales and regional developers • Expanding company - owned/managed clinics • Buybacks: Acquired a franchised clinic in San Diego in April 2018 and evaluating additional opportunities • Assessing greenfield opportunities with lease LOIs signed; build - outs averaging 6 to 9 months 92% CAGR (7 year) SYSTEM - WIDE GROSS SALES ($ in M) Leader Executing Growth Strategy: 413 Clinics 4 © 2018 | NASDAQ: JYNT | thejoint.com $1.3 $2.8 $8.1 $22.3 $46.2 $70.1 $98.6 $126.9 $76.4 2010 2011 2012 2013 2014 2015 2016 2017 Q2 2018 312 370 413 399 246
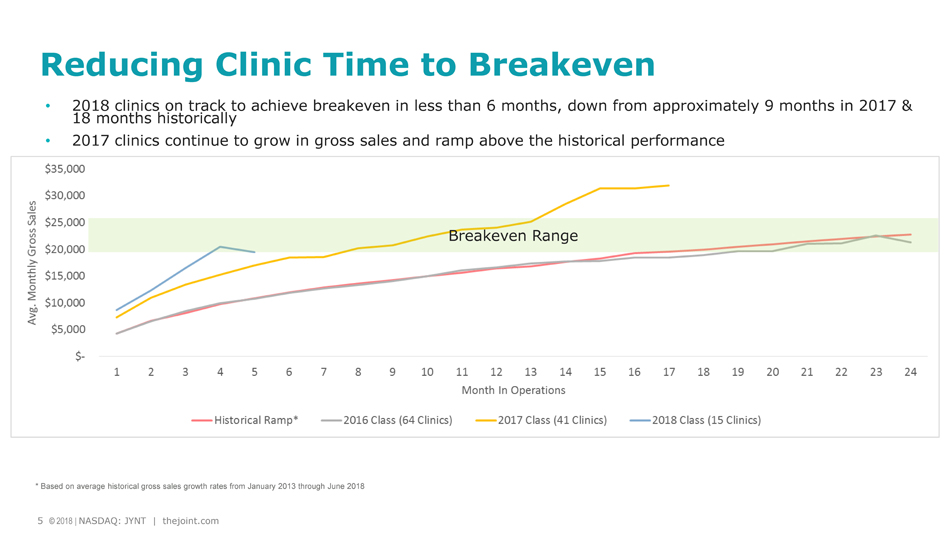
5 © 2018 | NASDAQ: JYNT | thejoint.com Achi Reducing Clinic Time to Breakeven • 2018 clinics on track to achieve breakeven in less than 6 months, down from approximately 9 months in 2017 & 18 months historically • 2017 clinics continue to grow in gross sales and ramp above the historical performance * Based on average historical gross sales growth rates from January 2013 through June 2018 5 © 2018 | NASDAQ: JYNT | thejoint.com Breakeven Range
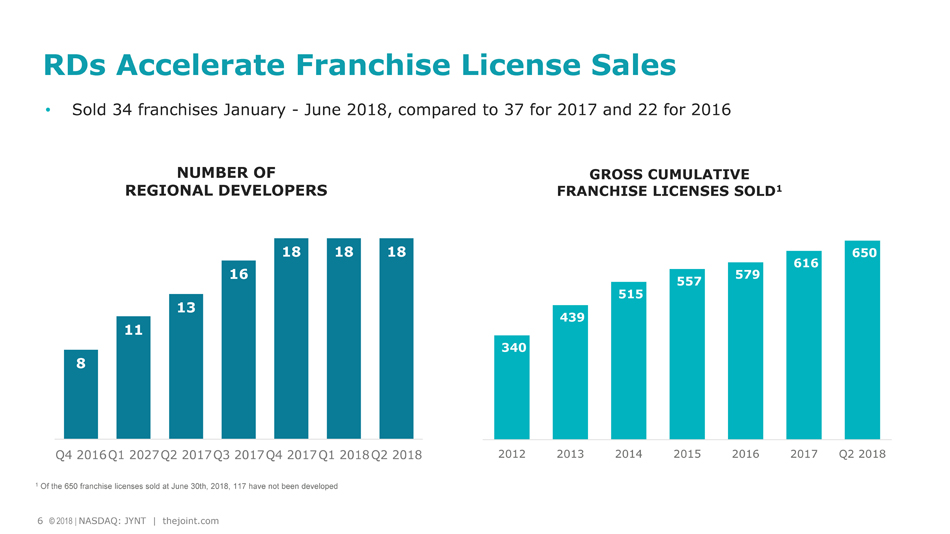
6 © 2018 | NASDAQ: JYNT | thejoint.com Franchise sales through June 2018 were 34, compared to 37 for all of 2017 • Sold 34 franchises January - June 2018, compared to 37 for 2017 and 22 for 2016 RDs Accelerate Franchise License Sales 8 11 13 16 18 18 18 Q4 2016 Q1 2027 Q2 2017 Q3 2017 Q4 2017 Q1 2018 Q2 2018 NUMBER OF REGIONAL DEVELOPERS 6 © 2018 | NASDAQ: JYNT | thejoint.com GROSS CUMULATIVE FRANCHISE LICENSES SOLD 1 1 Of the 650 franchise licenses sold at June 30th, 2018, 117 have not been developed 340 439 515 557 579 616 650 2012 2013 2014 2015 2016 2017 Q2 2018
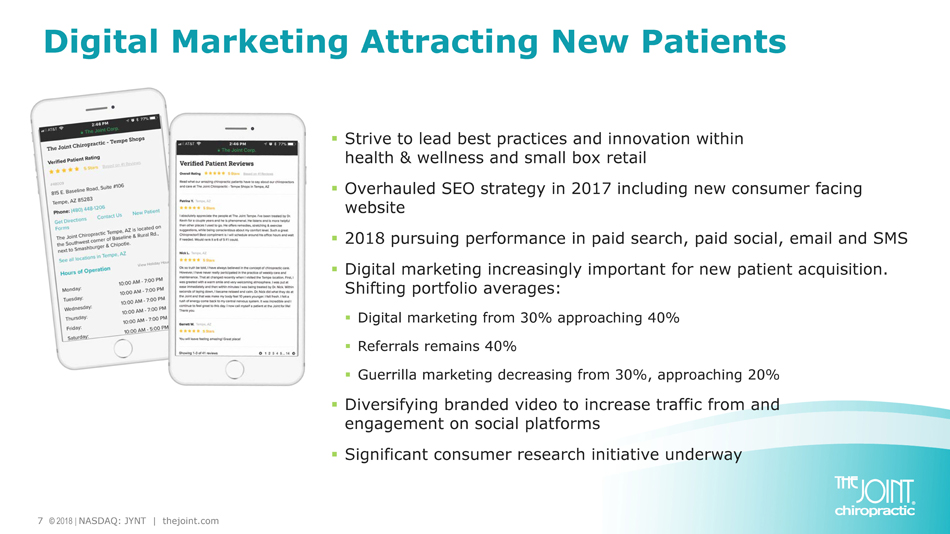
7 © 2018 | NASDAQ: JYNT | thejoint.com Digital Marketing Attracting New Patients ▪ Strive to lead best practices and innovation within health & wellness and small box retail ▪ Overhauled SEO strategy in 2017 including new consumer facing website ▪ 2018 pursuing performance in paid search, paid social, email and SMS ▪ Digital marketing increasingly important for new patient acquisition. Shifting portfolio averages: ▪ Digital marketing from 30% approaching 40% ▪ Referrals remains 40% ▪ Guerrilla marketing decreasing from 30%, approaching 20% ▪ Diversifying branded video to increase traffic from and engagement on social platforms ▪ Significant consumer research initiative underway
8 © 2018 | NASDAQ: JYNT | thejoint.com Implementing New IT Platform ▪ Clinic portfolio expanded to reach critical mass while third - party CRM costs decreased and external security risks increased ▪ Chosen to implement third - party CRM rather than upgrade home - grown proprietary platform ▪ Expect the new IT platform to improve ability to provide feature enhancements, system upgrades and state - of - the - art security features across entire portfolio ▪ Scale of current and planned clinic portfolio makes third - party solution more economical over long run ▪ Estimated cost to implement comparable to cost of upgrading home - grown proprietary platform ▪ Anticipate approximately $500K non - cash write - off of prior capitalized IT development in Q3
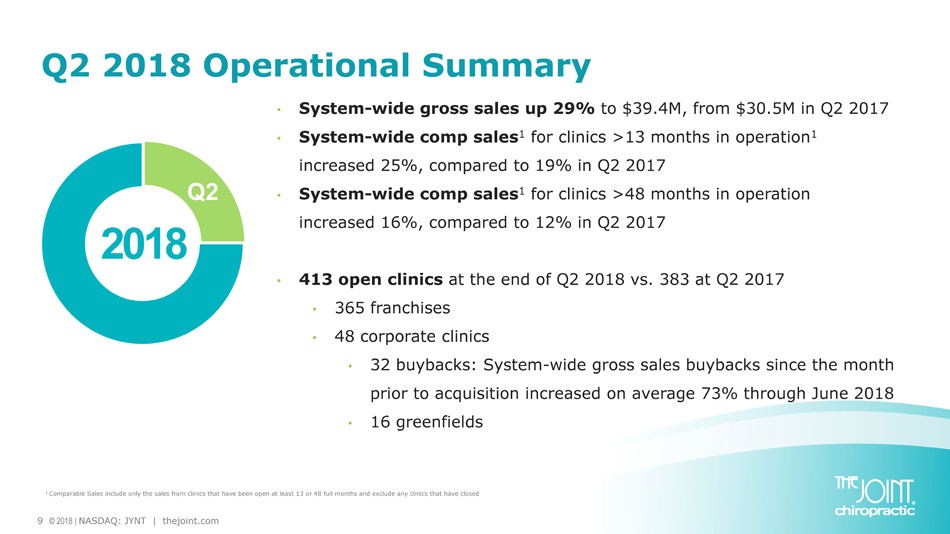
9 © 2018 | NASDAQ: JYNT | thejoint.com Q2 2018 Operational Summary • System - wide gross sales up 29% to $39.4M, from $30.5M in Q2 2017 • System - wide comp sales 1 for clinics >13 months in operation 1 increased 25%, compared to 19% in Q2 2017 • System - wide comp sales 1 for clinics >48 months in operation increased 16%, compared to 12% in Q2 2017 • 413 open clinics at the end of Q2 2018 vs. 383 at Q2 2017 • 365 franchises • 48 corporate clinics • 32 buybacks: System - wide gross sales buybacks since the month prior to acquisition increased on average 73% through June 2018 • 16 greenfields 2018 Q2 1 Comparable Sales include only the sales from clinics that have been open at least 13 or 48 full months and exclude any clinic s t hat have closed
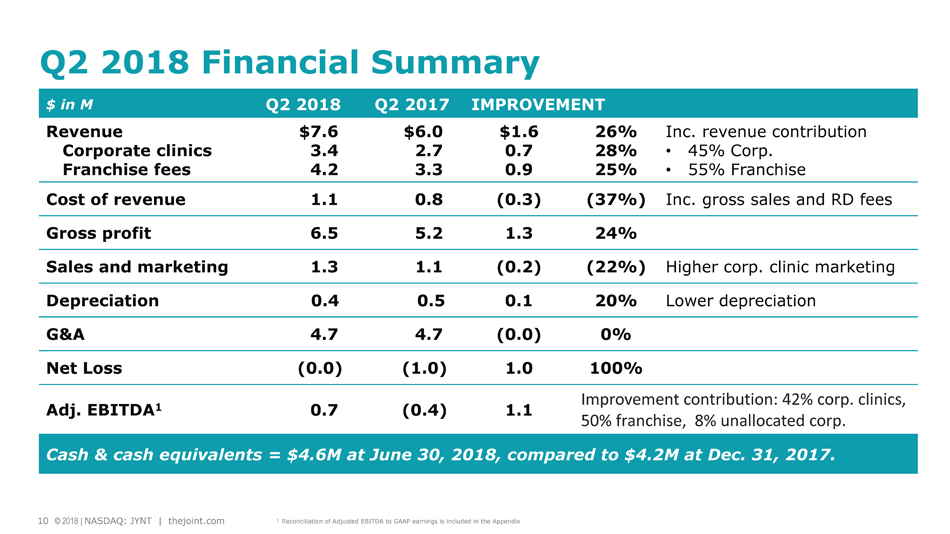
10 © 2018 | NASDAQ: JYNT | thejoint.com Achi $ in M Q2 2018 Q2 2017 IMPROVEMENT Revenue Corporate clinics Franchise fees $7.6 3.4 4.2 $6.0 2.7 3.3 $1.6 0.7 0.9 26% 28% 25% Inc. revenue contribution • 45% Corp. • 55% Franchise Cost of revenue 1.1 0.8 (0.3) (37%) Inc. gross sales and RD fees Gross profit 6.5 5.2 1.3 24% Sales and marketing 1.3 1.1 (0.2) (22%) Higher corp. clinic marketing Depreciation 0.4 0.5 0.1 20% Lower depreciation G&A 4.7 4.7 (0.0) 0% Net Loss (0.0) (1.0) 1.0 100% Adj. EBITDA 1 0.7 (0.4) 1.1 Improvement contribution: 42% corp. clinics, 50% franchise, 8% unallocated corp. Cash & cash equivalents = $ 4.6M at June 30, 2018, compared to $4.2M at Dec. 31, 2017. Q2 2018 Financial Summary 10 © 2018 | NASDAQ: JYNT | thejoint.com 1 Reconciliation of Adjusted EBITDA to GAAP earnings is included in the Appendix
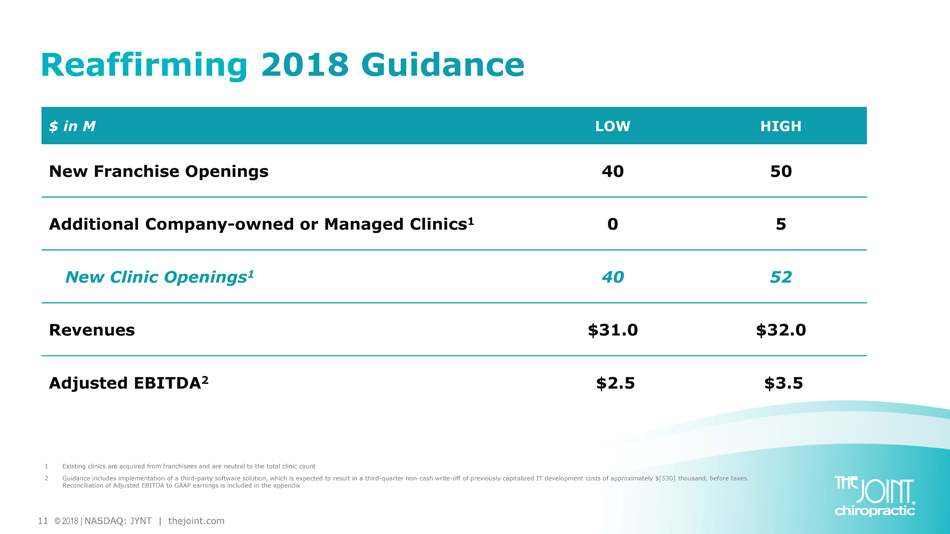
11 © 2018 | NASDAQ: JYNT | thejoint.com $ in M LOW HIGH New Franchise Openings 40 50 Additional Company - owned or Managed Clinics 1 0 5 New Clinic Openings 1 40 52 Revenues $31.0 $32.0 Adjusted EBITDA 2 $2.5 $3.5 Reaffirming 2018 Guidance 1 Existing clinics are acquired from franchisees and are neutral to the total clinic count 2 Guidance includes implementation of a third - party software solution, which is expected to result in a third - quarter non - cash wri te - off of previously capitalized IT development costs of approximately $[530] thousand, before taxes. Reconciliation of Adjusted EBITDA to GAAP earnings is included in the appendix

12 © 2018 | NASDAQ: JYNT | thejoint.com Opportunity in Highly Fragmented Market Chiropractic care represents only • 17% of $90B in back pain alone • 2% of $650B in pain costs $15B 1 on chiropractic care 39,000 2 independent practitioners 1 IBIS World Chiropractors Market Research Report; August 2016 2 Kentley Insights, The 2017 Office of Chiropractors Market Research Report 3 Gallup - Palmer College of Chiropractic Report 2017 4 The SPINE Journal 2018
13 © 2018 | NASDAQ: JYNT | thejoint.com 2018 Growth Strategy: Driving Scale • Accelerate franchise sales • Leverage Regional Developers • Reengage growth of company owned/managed units • Acquire buyback clinics opportunistically • Build greenfield clinics in clustered locations Building nationwide brand to deliver shareholder value
Non - GAAP Measure Definition This presentation includes a presentation of EBITDA and Adjusted EBITDA, which are non - GAAP financial measures. EBITDA and Adjusted EBITDA are presented because they are important measures used by management to assess financial performance, as management believes they provide a more transparent view of the Company’s underlying operating performance and operating trends. Reconciliations of net loss to EBITDA and Adjusted EBITDA are presented where applicable. The Company defines EBITDA as net income (loss) before net interest, taxes, depreciation and amortization expenses. The Company defines Adjusted EBITDA as EBITDA before acquisition - related expenses, bargain purchase gain, loss on disposition or impairment, and stock - based compensation expenses. EBITDA and Adjusted EBITDA do not represent and should not be considered alternatives to net income or cash flows from operations, as determined by accounting principles generally accepted in the United States, or GAAP. While EBITDA and Adjusted EBITDA are frequently used as measures of financial performance and the ability to meet debt service requirements, they are not necessarily comparable to other similarly titled captions of other companies due to potential inconsistencies in the methods of calculation. EBITDA and Adjusted EBITDA should be reviewed in conjunction with the Company’s financial statements filed with the SEC. 14 © 2018 | NASDAQ: JYNT | thejoint.com
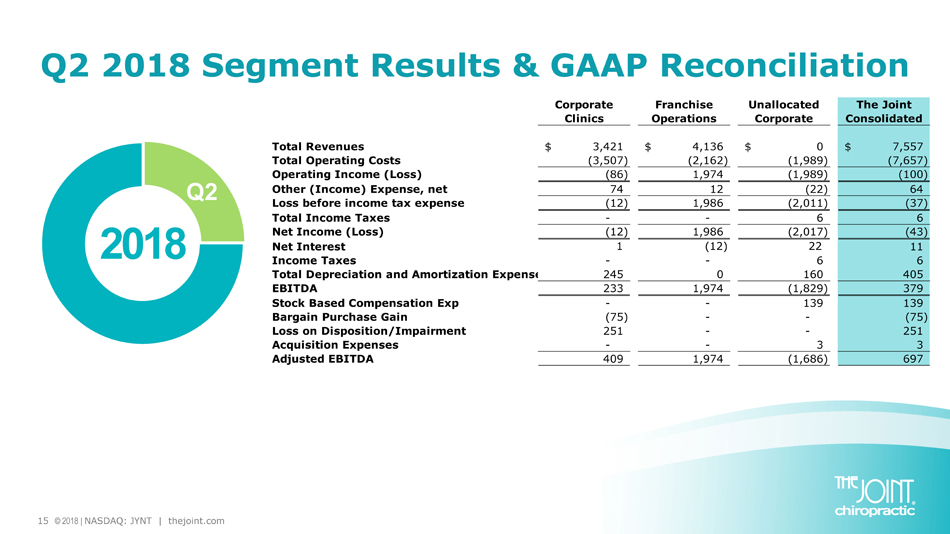
15 © 2018 | NASDAQ: JYNT | thejoint.com Q2 2018 Segment Results & GAAP Reconciliation 2018 Q2 Corporate Clinics Franchise Operations Unallocated Corporate The Joint Consolidated Total Revenues 3,421$ 4,136$ 0$ 7,557$ Total Operating Costs (3,507) (2,162) (1,989) (7,657) Operating Income (Loss) (86) 1,974 (1,989) (100) Other (Income) Expense, net 74 12 (22) 64 Loss before income tax expense (12) 1,986 (2,011) (37) Total Income Taxes - - 6 6 Net Income (Loss) (12) 1,986 (2,017) (43) Net Interest 1 (12) 22 11 Income Taxes - - 6 6 Total Depreciation and Amortization Expense 245 0 160 405 EBITDA 233 1,974 (1,829) 379 Stock Based Compensation Exp - - 139 139 Bargain Purchase Gain (75) - - (75) Loss on Disposition/Impairment 251 - - 251 Acquisition Expenses - - 3 3 Adjusted EBITDA 409 1,974 (1,686) 697
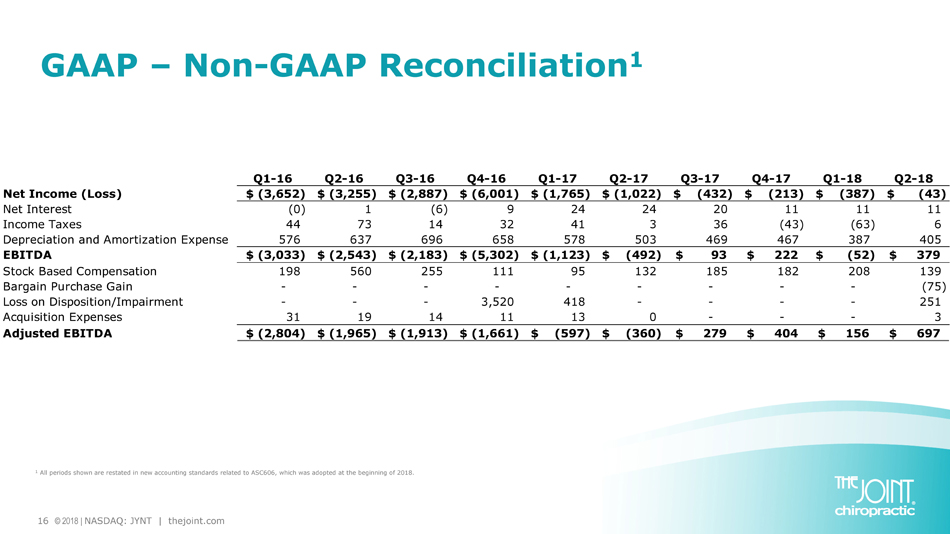
16 © 2018 | NASDAQ: JYNT | thejoint.com GAAP – Non - GAAP Reconciliation 1 1 All periods shown are restated in new accounting standards related to ASC606, which was adopted at the beginning of 2018. Q1-16 Q2-16 Q3-16 Q4-16 Q1-17 Q2-17 Q3-17 Q4-17 Q1-18 Q2-18 Net Income (Loss) (3,652)$ (3,255)$ (2,887)$ (6,001)$ (1,765)$ (1,022)$ (432)$ (213)$ (387)$ (43)$ Net Interest (0) 1 (6) 9 24 24 20 11 11 11 Income Taxes 44 73 14 32 41 3 36 (43) (63) 6 Depreciation and Amortization Expense 576 637 696 658 578 503 469 467 387 405 EBITDA (3,033)$ (2,543)$ (2,183)$ (5,302)$ (1,123)$ (492)$ 93$ 222$ (52)$ 379$ Stock Based Compensation 198 560 255 111 95 132 185 182 208 139 Bargain Purchase Gain - - - - - - - - - (75) Loss on Disposition/Impairment - - - 3,520 418 - - - - 251 Acquisition Expenses 31 19 14 11 13 0 - - - 3 Adjusted EBITDA (2,804)$ (1,965)$ (1,913)$ (1,661)$ (597)$ (360)$ 279$ 404$ 156$ 697$

17 © 2018 | NASDAQ: JYNT | thejoint.com Peter D. Holt, President and CEO peter.holt@thejoint.com Jake Singleton, Corporate Controller jake.singleton@thejoint.com Kirsten Chapman, LHA Investor Relations thejoint@lhai.com The Joint Corp. Contact Information https://www.facebook.com/thejointchiro @ thejointchiro https://twitter.com/thejointchiro @ thejointchiro https://www.youtube.com/thejointcorp @ thejointcorp The Joint Corp. | 16767 N. Perimeter Dr., Suite 240 | Scottsdale, AZ 85260 | (480) 245 - 5960