
EXHIBIT 99.2
REINVENTING CHIROPRACTIC CARE THE JOINT CORP. | NASDAQ: JYNT | thejoint.com Q1 2018 FINANCIAL RESULTS AS OF MAY 10, 2018
Safe Harbor Statement Certain statements contained in this presentation are "forward - looking statements." We have tried to identify these forward - look ing statements by using words such as "may," "might," " will," "expect,” "anticipate,'' "'believe,“ "could," " intend," "plan," "estimate," "should," "if,“ "project," and similar expressio ns. All statements other than statements of historical facts contained in this presentation, including statements regarding our growth strategies, our vision, future operations, future financial posi tio n, future revenue, projected costs, prospects, plans, objectives of management and expected market growth and potential are forward - looking statements. We have based these forward - looking statemen ts on our current expectations and projections about future events. However, these forward - looking statements are subject to risks, uncertainties, assumptions and other factors that may cause our actual results, performance or achievements to be materially different from our expectations and projections. Some of these risks, uncertainties and other factors are set f ort h in this presentation and in other documents we file with the United States Securities and Exchange Commission (the "SEC"). Given these risks and uncertainties, readers are cautioned not to place undue reliance on our forward - looking statements. Projec tions and other forward - looking statements included in this presentation have been prepared based on assumptions, which we believe to be reasonable, but not in accordance with U.S. Gene ral ly Accepted Accounting Principals (“GAAP”) or any guidelines of the SEC. Actual results may vary, perhaps materially. You are strongly cautioned not to place undue reliance on su ch projections and other forward - looking statements. All subsequent written and oral forward - looking statements attributable us or to persons acting on our behalf are expressly qualifie d in their entirety by these cautionary statements. Except as required by federal securities laws, we disclaim any intention or obligation to update or revise any forward - looking statements, whether as a result of new information, future events or otherwise. Any such forward - looking statements, whether made in this presentation or elsewhere, should be considered in the cont ext of the various disclosures made by us about our businesses including, without limitation, the risk factors discussed above. In addition to results presented in accordance with U.S. GAAP, this presentation includes a presentation of EBITDA and Adjust ed EBITDA, which are non - GAAP financial measures. EBITDA and Adjusted EBITDA are presented because they are important measures used by management to assess financial performance, as mana gem ent believes they provide a more transparent view of the Company’s underlying operating performance and operating trends. Reconciliations of net loss to EBITDA and Adjusted EBITD A a re presented where applicable. We define EBITDA as net income (loss) before net interest, taxes, depreciation and amortization expenses. We define Adjusted EBITDA as EBITDA before acq uisition - related expenses, bargain purchase gain, loss on disposition or impairment, and stock - based compensation expenses. EBITDA and Adjusted EBITDA do not represent and should not be considered alternatives to net income or cash flows from operat ion s, as determined by GAAP. While EBITDA and Adjusted EBITDA are frequently used as measures of financial performance and the ability to meet debt service requirements, they are n ot necessarily comparable to other similarly titled captions of other companies due to potential inconsistencies in the methods of calculation. EBITDA and Adjusted EBITDA should be reviewed in conjunction with our financial statements filed with the SEC. Business Structure The Joint Corp. is a franchisor of clinics and an operator of clinics in certain states. In Arkansas, California, Colorado, Florida, Illinois, Kansas, Minnesota, New Jersey, New York, North Carolina, Oregon, Pennsylvania, and Tennessee, The Joint Corp. and its franchisees provide management services to affiliated professional chiropractic practices. 2 © 2018 | NASDAQ: JYNT | thejoint.com
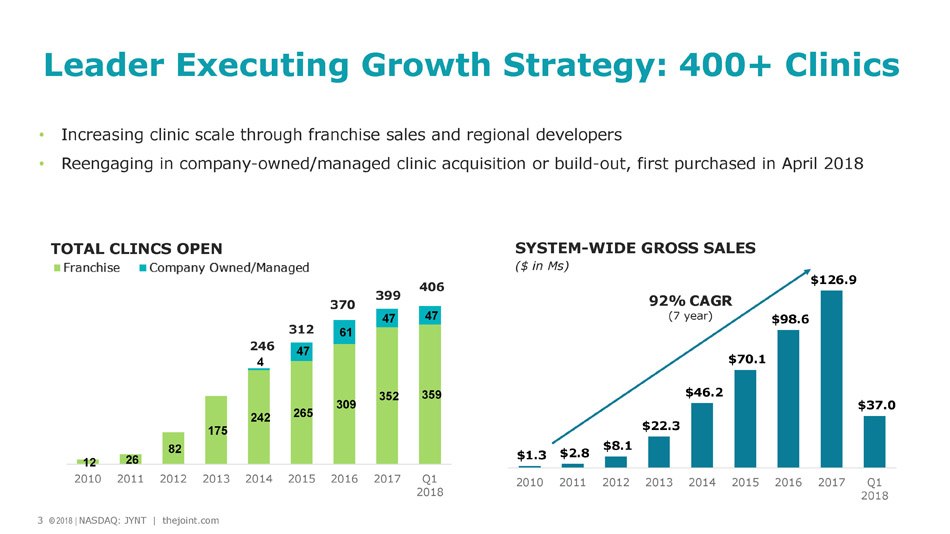
3 © 2018 | NASDAQ: JYNT | thejoint.com Achi • Increasing clinic scale through franchise sales and regional developers • Reengaging in company - owned/managed clinic acquisition or build - out, first purchased in April 2018 92% CAGR (7 year) SYSTEM - WIDE GROSS SALES ($ in Ms ) Leader Executing Growth Strategy: 400+ Clinics 3 © 2018 | NASDAQ: JYNT | thejoint.com 12 26 82 175 242 265 309 352 359 4 47 61 47 47 2010 2011 2012 2013 2014 2015 2016 2017 Q1 2018 312 370 246 406 TOTAL CLINCS OPEN 399 $1.3 $2.8 $8.1 $22.3 $46.2 $70.1 $98.6 $126.9 $37.0 2010 2011 2012 2013 2014 2015 2016 2017 Q1 2018
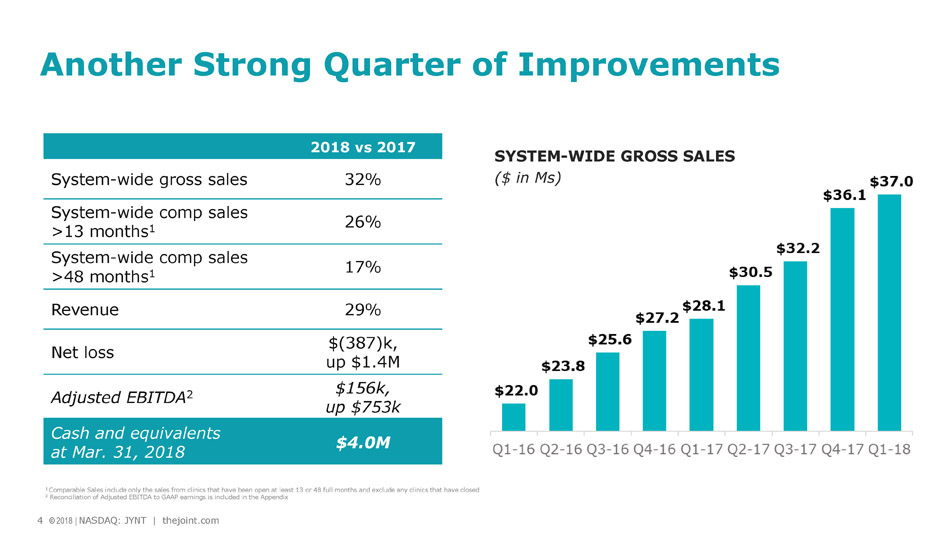
4 © 2018 | NASDAQ: JYNT | thejoint.com Achi Another Strong Quarter of Improvements 2018 vs 2017 System - wide gross sales 32% System - wide comp sales >13 months 1 26% System - wide comp sales >48 months 1 17% Revenue 29% Net loss $(387)k, up $1.4M Adjusted EBITDA 2 $156k, up $753k Cash and equivalents at Mar. 31, 2018 $4.0M 1 Comparable Sales include only the sales from clinics that have been open at least 13 or 48 full months and exclude any clinic s t hat have closed 2 Reconciliation of Adjusted EBITDA to GAAP earnings is included in the Appendix SYSTEM - WIDE GROSS SALES ($ in Ms ) 4 © 2018 | NASDAQ: JYNT | thejoint.com
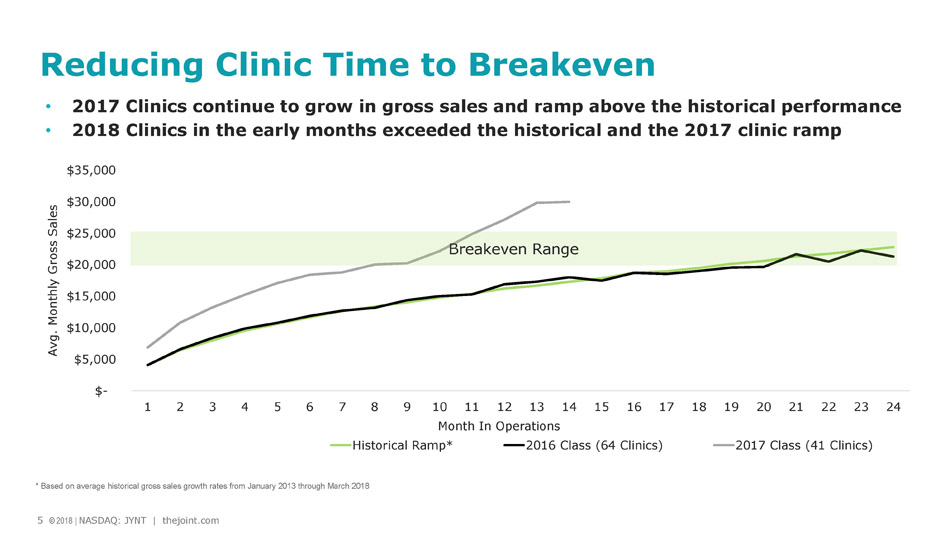
5 © 2018 | NASDAQ: JYNT | thejoint.com Achi $- $5,000 $10,000 $15,000 $20,000 $25,000 $30,000 $35,000 1 2 3 4 5 6 7 8 9 10 11 12 13 14 15 16 17 18 19 20 21 22 23 24 Avg. Monthly Gross Sales Month In Operations Historical Ramp* 2016 Class (64 Clinics) 2017 Class (41 Clinics) Reducing Clinic Time to Breakeven • 2017 Clinics continue to grow in gross sales and ramp above the historical performance • 2018 Clinics in the early months exceeded the historical and the 2017 clinic ramp Breakeven Range * Based on average historical gross sales growth rates from January 2013 through March 2018 5 © 2018 | NASDAQ: JYNT | thejoint.com
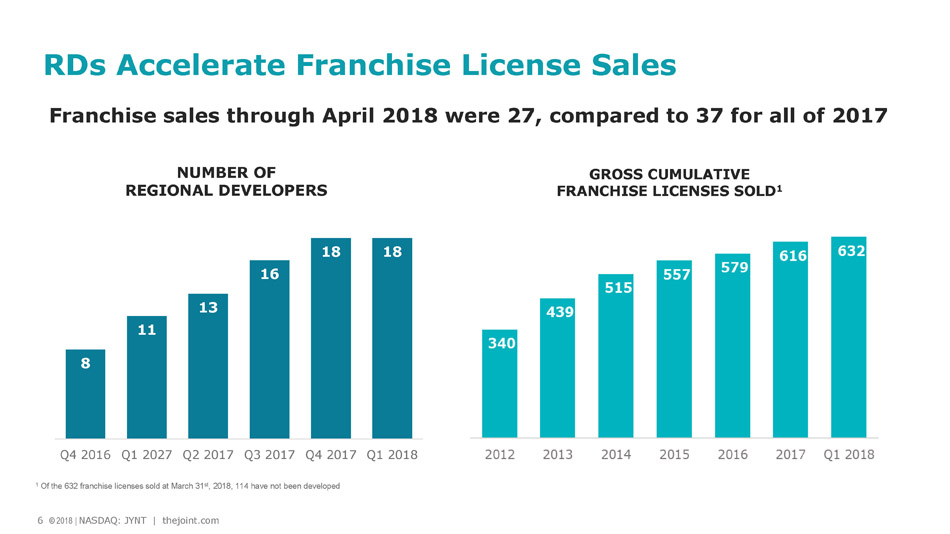
6 © 2018 | NASDAQ: JYNT | thejoint.com Achi RDs Accelerate Franchise License Sales 8 11 13 16 18 18 Q4 2016 Q1 2027 Q2 2017 Q3 2017 Q4 2017 Q1 2018 Franchise sales through April 2018 were 27, compared to 37 for all of 2017 NUMBER OF REGIONAL DEVELOPERS 6 © 2018 | NASDAQ: JYNT | thejoint.com GROSS CUMULATIVE FRANCHISE LICENSES SOLD 1 1 Of the 632 franchise licenses sold at March 31 st , 2018, 114 have not been developed
7 © 2018 | NASDAQ: JYNT | thejoint.com IT Supports Franchises, RDs & Corp. Clinics ▪ Launched a new sophisticated cloud - based franchise management software and communication platform ▪ Provides access tools, documents, resources; disseminate communications, assign tasks, join events, engage and contribute feedback ▪ Improves lines of communication with franchisees ▪ Streamlines by integrating or replacing multiple, preexisting communication platforms ▪ Implementing Atlas 2.0 upgrade
8 © 2018 | NASDAQ: JYNT | thejoint.com Digital Marketing to Drive Growth ▪ Strive to lead best practices and innovation within health & wellness and small box retail ▪ Overhauled SEO strategy including new consumer facing website ▪ Yielding strong gains in web traffic, leads and new patient conversion ▪ Helping fuel sales growth, accelerate new clinic ramp to profitability, optimize advertising spend ▪ Pursuing performance in paid search, paid social, email and SMS ▪ Diversifying branded video to increase traffic from and engagement on social platforms
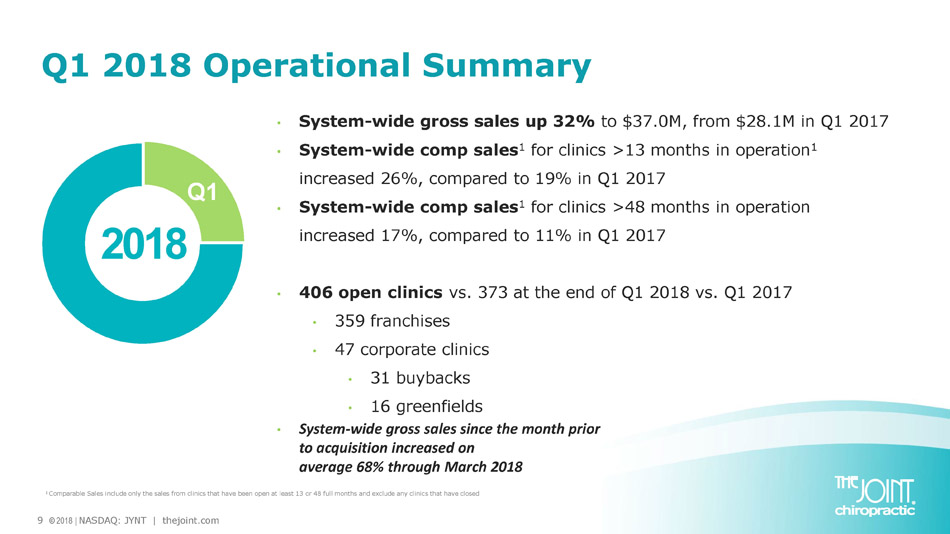
9 © 2018 | NASDAQ: JYNT | thejoint.com Q1 2018 Operational Summary • System - wide gross sales up 32% to $37.0M, from $28.1M in Q1 2017 • System - wide comp sales 1 for clinics >13 months in operation 1 increased 26%, compared to 19% in Q1 2017 • System - wide comp sales 1 for clinics >48 months in operation increased 17%, compared to 11% in Q1 2017 • 406 open clinics vs. 373 at the end of Q1 2018 vs. Q1 2017 • 359 franchises • 47 corporate clinics • 31 buybacks • 16 greenfields • System - wide gross sales since the month prior to acquisition increased on average 68% through March 2018 2018 Q1 1 Comparable Sales include only the sales from clinics that have been open at least 13 or 48 full months and exclude any clinic s t hat have closed
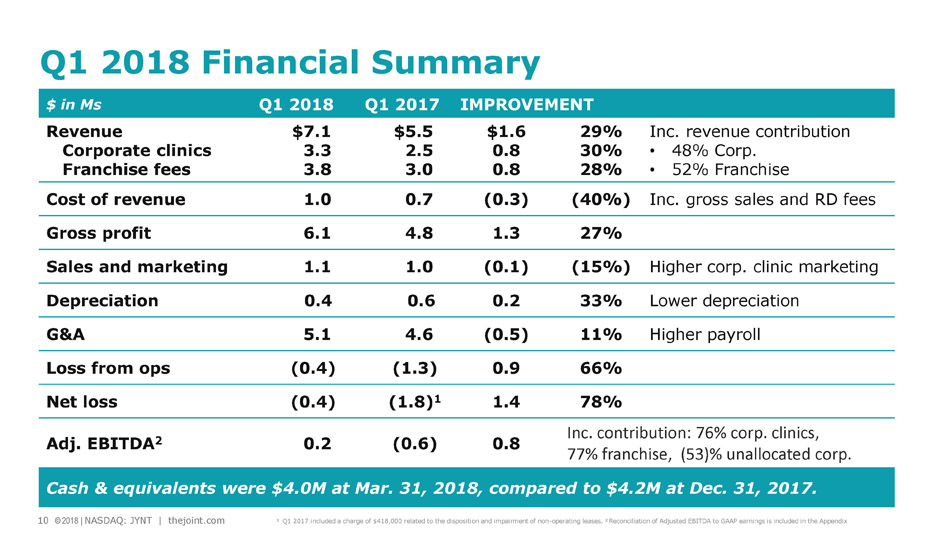
10 © 2018 | NASDAQ: JYNT | thejoint.com Achi $ in Ms Q1 2018 Q1 2017 IMPROVEMENT Revenue Corporate clinics Franchise fees $7.1 3.3 3.8 $5.5 2.5 3.0 $1.6 0.8 0.8 29% 30% 28% Inc. revenue contribution • 48% Corp. • 52% Franchise Cost of revenue 1.0 0.7 (0.3) (40%) Inc. gross sales and RD fees Gross profit 6.1 4.8 1.3 27% Sales and marketing 1.1 1.0 (0.1) (15%) Higher corp. clinic marketing Depreciation 0.4 0.6 0.2 33% Lower depreciation G&A 5.1 4.6 (0.5) 11% Higher payroll Loss from ops (0.4) (1.3) 0.9 66% Net loss (0.4) (1.8) 1 1.4 78% Adj. EBITDA 2 0.2 (0.6) 0.8 Inc. contribution: 76% corp. clinics, 77% franchise, (53)% unallocated corp. Cash & equivalents were $ 4.0M at Mar. 31, 2018, compared to $4.2M at Dec. 31, 2017. Q1 2018 Financial Summary 10 © 2018 | NASDAQ: JYNT | thejoint.com 1 Q1 2017 included a charge of $418,000 related to the disposition and impairment of non - operating leases. 2 Reconciliation of Adjusted EBITDA to GAAP earnings is included in the Appendix
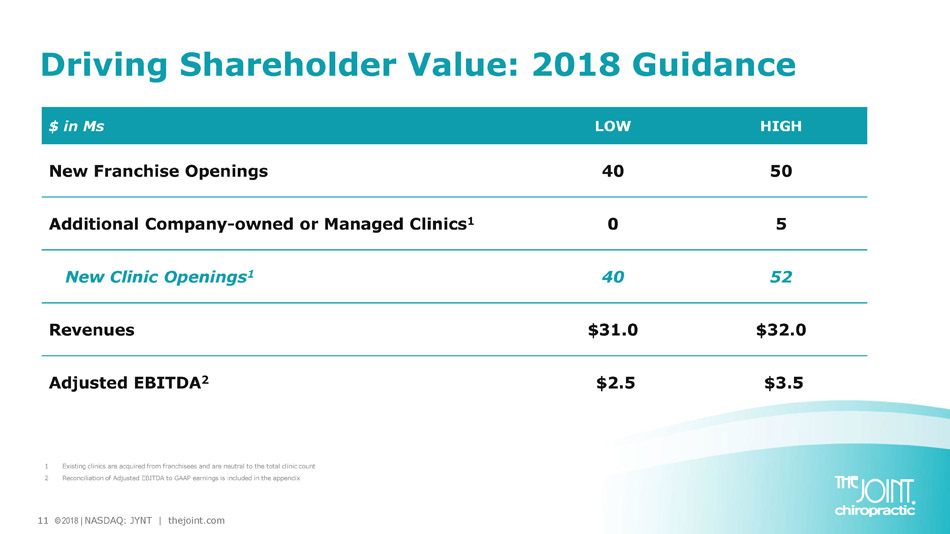
11 © 2018 | NASDAQ: JYNT | thejoint.com $ in Ms LOW HIGH New Franchise Openings 40 50 Additional Company - owned or Managed Clinics 1 0 5 New Clinic Openings 1 40 52 Revenues $31.0 $32.0 Adjusted EBITDA 2 $2.5 $3.5 Driving Shareholder Value: 2018 Guidance 1 Existing clinics are acquired from franchisees and are neutral to the total clinic count 2 Reconciliation of Adjusted EBITDA to GAAP earnings is included in the appendix
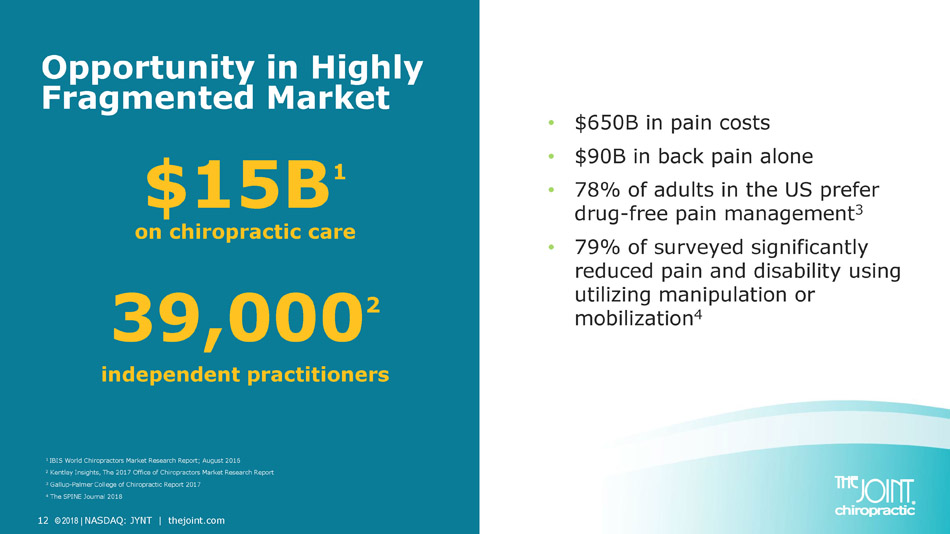
12 © 2018 | NASDAQ: JYNT | thejoint.com Opportunity in Highly Fragmented Market • $650B in pain costs • $90B in back pain alone • 78% of adults in the US prefer drug - free pain management 3 • 79% of surveyed significantly reduced pain and disability using utilizing manipulation or mobilization 4 $15B 1 on chiropractic care 39,000 2 independent practitioners 1 IBIS World Chiropractors Market Research Report; August 2016 2 Kentley Insights, The 2017 Office of Chiropractors Market Research Report 3 Gallup - Palmer College of Chiropractic Report 2017 4 The SPINE Journal 2018
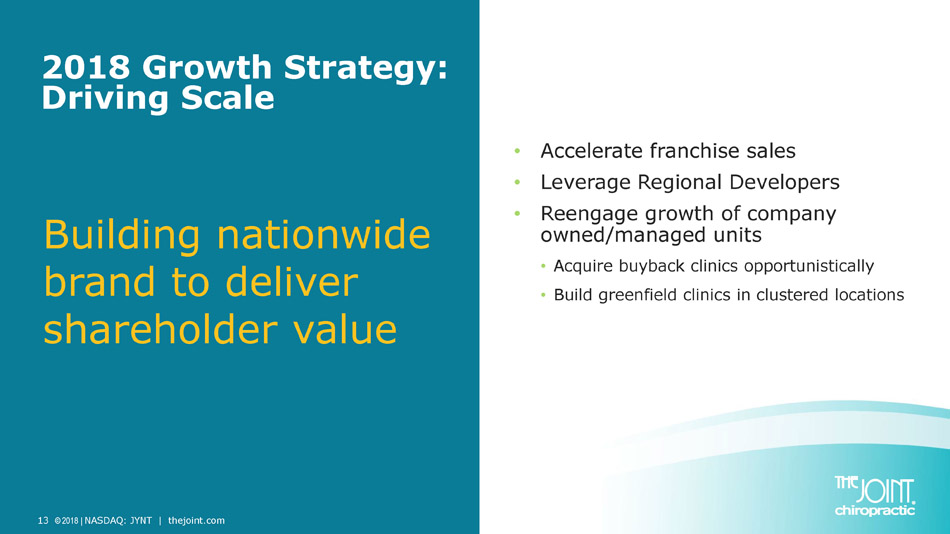
13 © 2018 | NASDAQ: JYNT | thejoint.com 2018 Growth Strategy: Driving Scale • Accelerate franchise sales • Leverage Regional Developers • Reengage growth of company owned/managed units • Acquire buyback clinics opportunistically • Build greenfield clinics in clustered locations Building nationwide brand to deliver shareholder value
14 © 2018 | NASDAQ: JYNT | thejoint.com Stable Model, Significant Growth Potential 1 IBIS World Chiropractors Market Research Report; August 2016 2 For the year - ended December 31, 2017 • $ 15B growing chiropractic market 1 • Experienced, proven management • 1,700+ clinic national footprint opportunity • 92% 7 - year CAGR in system - wide gross sales 2 • 22% of The Joint patients are new to chiropractic 2 • 76% of revenue from recurring memberships 2 • High returns, self funding growth strategy
Non - GAAP Measure Definition This presentation includes a presentation of EBITDA and Adjusted EBITDA, which are non - GAAP financial measures. EBITDA and Adjusted EBITDA are presented because they are important measures used by management to assess financial performance, as management believes they provide a more transparent view of the Company’s underlying operating performance and operating trends. Reconciliations of net loss to EBITDA and Adjusted EBITDA are presented where applicable. The Company defines EBITDA as net income (loss) before net interest, taxes, depreciation and amortization expenses. The Company defines Adjusted EBITDA as EBITDA before acquisition - related expenses, bargain purchase gain, loss on disposition or impairment, and stock - based compensation expenses. EBITDA and Adjusted EBITDA do not represent and should not be considered alternatives to net income or cash flows from operations, as determined by accounting principles generally accepted in the United States, or GAAP. While EBITDA and Adjusted EBITDA are frequently used as measures of financial performance and the ability to meet debt service requirements, they are not necessarily comparable to other similarly titled captions of other companies due to potential inconsistencies in the methods of calculation. EBITDA and Adjusted EBITDA should be reviewed in conjunction with the Company’s financial statements filed with the SEC. 15 © 2018 | NASDAQ: JYNT | thejoint.com
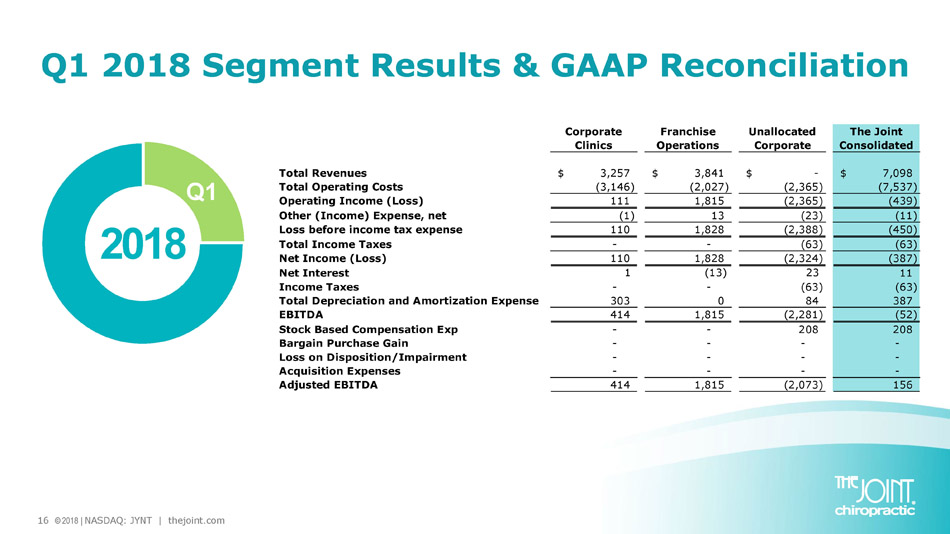
16 © 2018 | NASDAQ: JYNT | thejoint.com Q1 2018 Segment Results & GAAP Reconciliation 2018 Q1 Corporate Clinics Franchise Operations Unallocated Corporate The Joint Consolidated Total Revenues 3,257$ 3,841$ -$ 7,098$ Total Operating Costs (3,146) (2,027) (2,365) (7,537) Operating Income (Loss) 111 1,815 (2,365) (439) Other (Income) Expense, net (1) 13 (23) (11) Loss before income tax expense 110 1,828 (2,388) (450) Total Income Taxes - - (63) (63) Net Income (Loss) 110 1,828 (2,324) (387) Net Interest 1 (13) 23 11 Income Taxes - - (63) (63) Total Depreciation and Amortization Expense 303 0 84 387 EBITDA 414 1,815 (2,281) (52) Stock Based Compensation Exp - - 208 208 Bargain Purchase Gain - - - - Loss on Disposition/Impairment - - - - Acquisition Expenses - - - - Adjusted EBITDA 414 1,815 (2,073) 156

17 © 2018 | NASDAQ: JYNT | thejoint.com Peter D. Holt, President and CEO peter.holt@thejoint.com John P. Meloun, Chief Financial Officer john.meloun@thejoint.com Kirsten Chapman, LHA Investor Relations thejoint@lhai.com The Joint Corp. Contact Information https://www.facebook.com/thejointchiro @ thejointchiro https://twitter.com/thejointchiro @ thejointchiro https://www.youtube.com/thejointcorp @ thejointcorp The Joint Corp. | 16767 N. Perimeter Dr., Suite 240 | Scottsdale, AZ 85260 | (480) 245 - 5960