
Exhibit 99.1
THE JOINT CORP. | NASDAQ: JYNT | thejoint.com Reinventing Chiropractic Care
Safe Harbor Statement Certain statements contained in this presentation are "forward - looking statements." We have tried to identify these forward - look ing statements by using words such as "may," "might," " will," "expect,” "anticipate,'' "'believe,“ "could," " intend," "plan," "estimate," "should," "if,“ "project," and similar ex pre ssions. All statements other than statements of historical facts contained in this presentation, including statements regarding our growth strategies, our vision, future operations, future f ina ncial position, future revenue, projected costs, prospects, plans, objectives of management and expected market growth and potential are forward - looking statements. We have based these forward - lo oking statements on our current expectations and projections about future events. However, these forward - looking statements are subject to risks, uncertainties, assumptions and other factors that may cause our actual results, performance or achievements to be materially different from our expectations and projections. Some of these risks, uncertainties and othe r f actors are set forth in this presentation and in other documents we file with the United States Securities and Exchange Commission (the "SEC"). Given these risks and uncertainties, readers are cautioned not to place undue reliance on our forward - looking statements. Projec tions and other forward - looking statements included in this presentation have been prepared based on assumptions, which we believe to be reasonable, but not in accordance with U.S. Gene ral ly Accepted Accounting Principals (“GAAP”) or any guidelines of the SEC. Actual results may vary, perhaps materially. You are strongly cautioned not to place undue reliance on su ch projections and other forward - looking statements. All subsequent written and oral forward - looking statements attributable us or to persons acting on our behalf are expressly qualifie d in their entirety by these cautionary statements. Except as required by federal securities laws, we disclaim any intention or obligation to update or revise any forward - looking statements, whether as a result of new information, future events or otherwise. Any such forward - looking statements, whether made in this presentation or elsewhere, should be considered in the cont ext of the various disclosures made by us about our businesses including, without limitation, the risk factors discussed above. In addition to results presented in accordance with U.S. GAAP, this presentation includes a presentation of EBITDA and Adjust ed EBITDA, which are non - GAAP financial measures. EBITDA and Adjusted EBITDA are presented because they are important measures used by management to assess financial performance, as mana gem ent believes they provide a more transparent view of the Company’s underlying operating performance and operating trends. Reconciliations of net loss to EBITDA and Adjusted EBITD A a re presented where applicable. We define EBITDA as net income (loss) before net interest, taxes, depreciation and amortization expenses. We define Adjusted EBITDA as EBITDA before acq uisition - related expenses, bargain purchase gain, loss on disposition or impairment, and stock - based compensation expenses. EBITDA and Adjusted EBITDA do not represent and should not be considered alternatives to net income or cash flows from operat ion s, as determined by GAAP. While EBITDA and Adjusted EBITDA are frequently used as measures of financial performance and the ability to meet debt service requirements, they are n ot necessarily comparable to other similarly titled captions of other companies due to potential inconsistencies in the methods of calculation. EBITDA and Adjusted EBITDA should be reviewed in conjunction with our financial statements filed with the SEC. Business Structure The Joint Corp. is a franchisor of clinics and an operator of clinics in certain states. In Arkansas, California, Colorado, Florida, Illinois, Kansas, Minnesota, New Jersey, New York, North Carolina, Oregon, Pennsylvania, and Tennessee, The Joint Co rp. and its franchisees provide management services to affiliated professional chiropractic practices. 2 © 2018 | NASDAQ: JYNT | thejoint.com

3 © 2018 | NASDAQ: JYNT | thejoint.com 3 © 2018 The Joint Corp. All Rights Reserved. Bringing quality, convenient, affordable chiropractic care to retail.
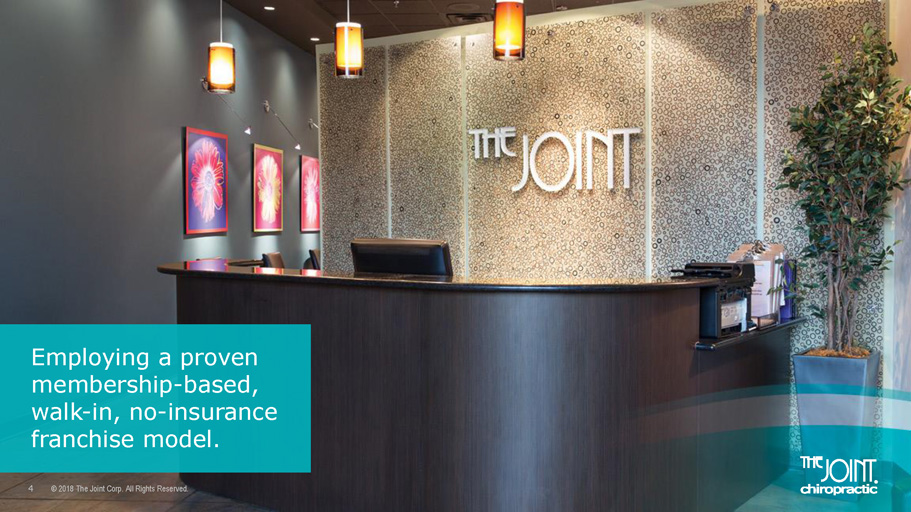
4 © 2018 | NASDAQ: JYNT | thejoint.com 4 © 2018 The Joint Corp. All Rights Reserved. Employing a proven membership - based, walk - in, no - insurance franchise model.

5 © 2018 | NASDAQ: JYNT | thejoint.com 5 © 2018 The Joint Corp. All Rights Reserved. Serving patients seeking pain relief and ongoing health and wellness in an open bay setting.
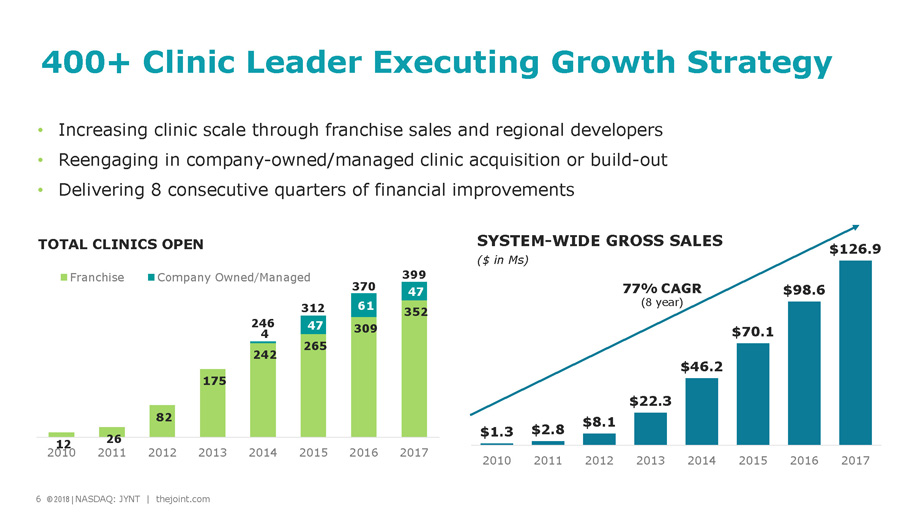
6 © 2018 | NASDAQ: JYNT | thejoint.com Achi • Increasing clinic scale through franchise sales and regional developers • Reengaging in company - owned/managed clinic acquisition or build - out • Delivering 8 consecutive quarters of financial improvements $1.3 $2.8 $8.1 $22.3 $46.2 $70.1 $98.6 $126.9 2010 2011 2012 2013 2014 2015 2016 2017 77% CAGR (8 year) SYSTEM - WIDE GROSS SALES ($ in Ms ) 400+ Clinic Leader Executing Growth Strategy 12 26 82 175 242 265 309 352 4 47 61 47 2010 2011 2012 2013 2014 2015 2016 2017 TOTAL CLINICS OPEN Franchise Company Owned/Managed 6 © 2018 | NASDAQ: JYNT | thejoint.com 312 370 246 399
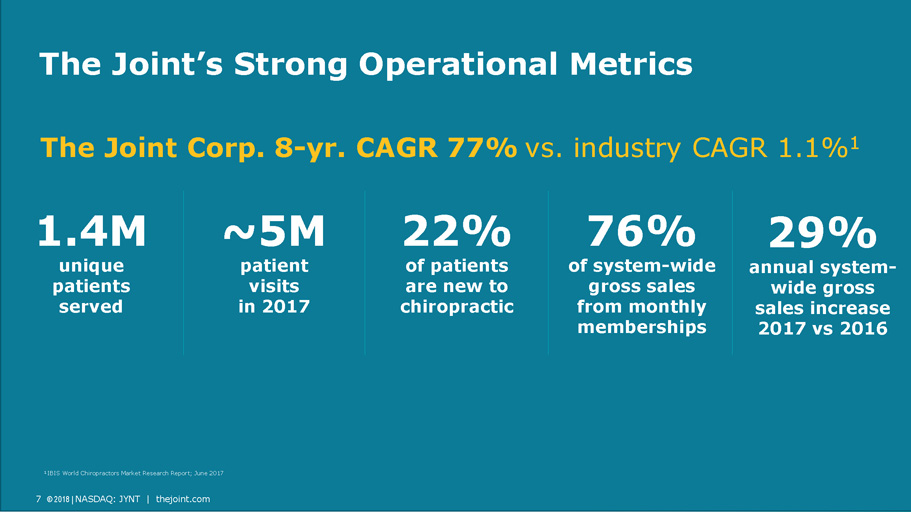
7 © 2018 | NASDAQ: JYNT | thejoint.com The Joint’s Strong Operational Metrics 1 IBIS World Chiropractors Market Research Report; June 2017 1.4M unique patients served 22% of patients are new to chiropractic ~5M patient visits in 2017 76% of system - wide gross sales from monthly memberships The Joint Corp. 8 - yr. CAGR 77% vs. industry CAGR 1.1% 1 29% annual system - wide gross sales increase 2017 vs 2016 7 © 2018 | NASDAQ: JYNT | thejoint.com

8 © 2018 | NASDAQ: JYNT | thejoint.com • $90B spent on back pain each year 1 • $15B growing chiropractic market 2 • 62M Americans saw a chiropractor in last 5 yr.s , 35.5M in last 12 mo.s 3 • ~80% of those surveyed want a non - pharmacologic approach to physical pain 3 • 55% reduction in the likelihood of people filling prescriptions for opioids in those who received chiropractic care 5 Chiropractic Market Large, fragmented, dynamic and growing 1 Bureau of Labor Statistics, U.S. Department of Labor, Occupational Outlook Handbook, 2016 - 17 Edition | 2 IBIS World Chiropractors Market Research Report; August 2016 | 3 Gallup - Palmer College of Chiropractic Report 2016 | 4 Noninvasive Treatments for Acute, Subacute, and Chronic Low Back Pain. Ann Intern Med. [ Epub ahead of print 14 February 2017] doi : 10.7326/P17 - 9032 | 5 Association between Utilization of Chiropractic Services and Use of Prescription Opioids Among Patients with Low Back Pain
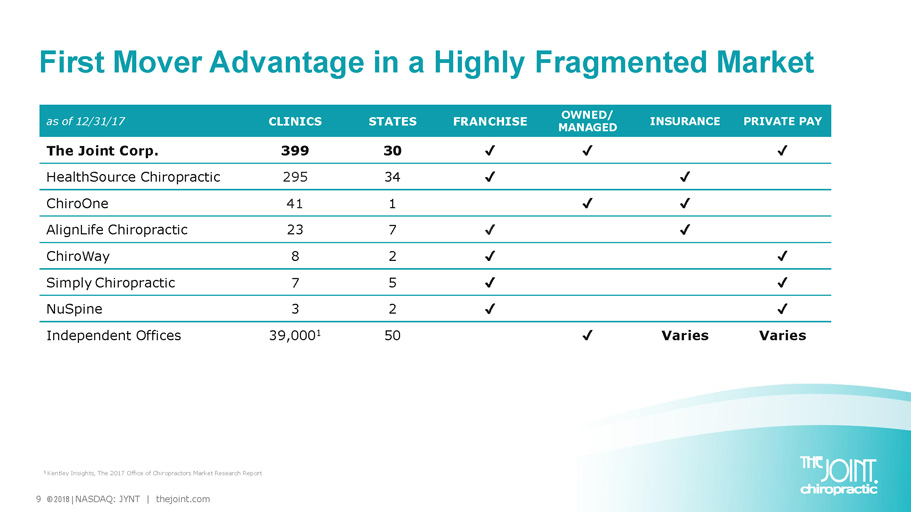
9 © 2018 | NASDAQ: JYNT | thejoint.com First Mover Advantage in a Highly Fragmented Market as of 12/31/17 CLINICS STATES FRANCHISE OWNED/ MANAGED INSURANCE PRIVATE PAY The Joint Corp. 399 30 ط ط ط HealthSource Chiropractic 295 34 ط ط ChiroOne 41 1 ط ط AlignLife Chiropractic 23 7 ط ط ChiroWay 8 2 ط ط Simply Chiropractic 7 5 ط ط NuSpine 3 2 ط ط Independent Offices 39,000 1 50 ط Varies Varies 1 Kentley Insights, The 2017 Office of Chiropractors Market Research Report

10 © 2018 | NASDAQ: JYNT | thejoint.com Revolutionizing Traditional Chiropractic Care FEATURES INDUSTRY PROBLEMS THE JOINT’S SOLUTIONS Affordability (per appointment) $ 74 Average 1 $ 26 Average Convenient Locations Medical Centers / Offices Retail Locations Multiple Locations Limited Locations 399 Units Walk - in / No Appointment Appointments Required No Appointments Insurance / Caps / Co - pays Yes Private Pay Inviting Consumer - centric Design Clinical Approachable, Consumer Friendly Service Hours Limited / Inconsistent Open 6 - 7 Days + Nights & Weekends 2 Average Patient Visits per Clinic Less Than 600 Per Month 3 1,000+ Per Month 4 1 Chiropractic Economics, October 2016 | 2 Hours vary by clinic | 3 Chiropractic Economics, May 2016 | 4 Number includes multiple visits per patient
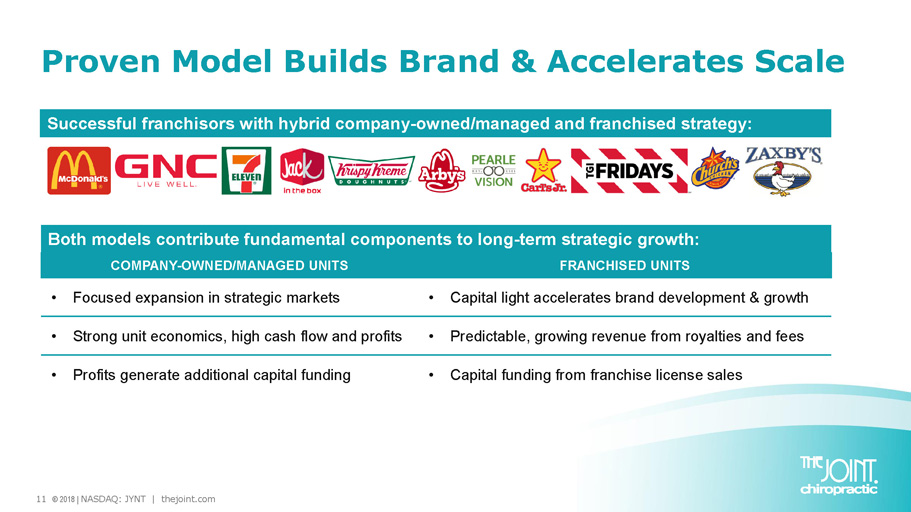
11 © 2018 | NASDAQ: JYNT | thejoint.com Successful franchisors with hybrid company - owned/managed and franchised strategy: COMPANY - OWNED/MANAGED UNITS FRANCHISED UNITS • Focused expansion in strategic markets • Capital light accelerates brand development & growth • Strong unit economics, high cash flow and profits • Predictable, growing revenue from royalties and fees • Profits generate additional capital funding • Capital funding from franchise license sales Both models contribute fundamental components to long - term strategic growth: Proven Model Builds Brand & Accelerates Scale
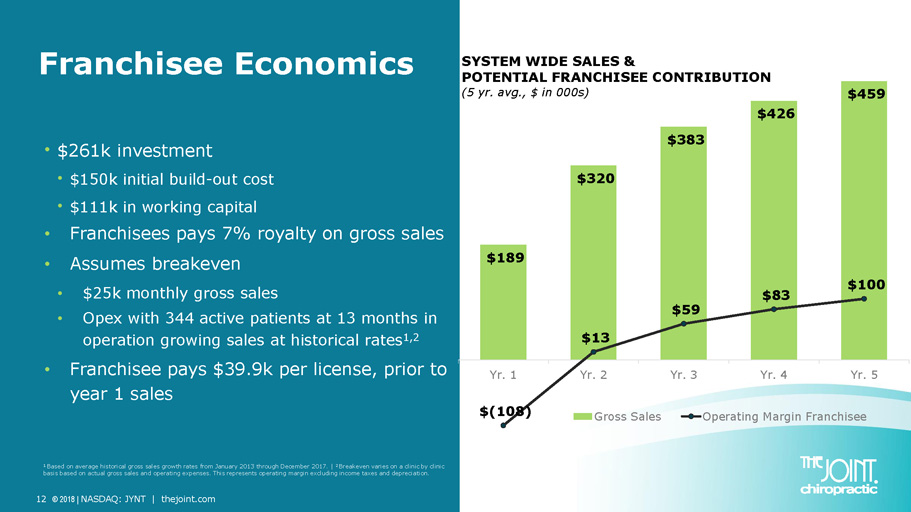
12 © 2018 | NASDAQ: JYNT | thejoint.com Franchisee Economics • $261k investment • $150k initial build - out cost • $111k in working capital • Franchisees pays 7% royalty on gross sales • Assumes breakeven • $25k monthly gross sales • Opex with 344 active patients at 13 months in operation growing sales at historical rates 1,2 • Franchisee pays $39.9k per license, prior to year 1 sales $189 $320 $383 $426 $459 $(108) $13 $59 $83 $100 Yr. 1 Yr. 2 Yr. 3 Yr. 4 Yr. 5 SYSTEM WIDE SALES & POTENTIAL FRANCHISEE CONTRIBUTION (5 yr. avg., $ in 000s) Gross Sales Operating Margin Franchisee 1 Based on average historical gross sales growth rates from January 2013 through December 2017. | 2 Breakeven varies on a clinic by clinic basis based on actual gross sales and operating expenses. This represents operating margin excluding income taxes and depreci ati on.
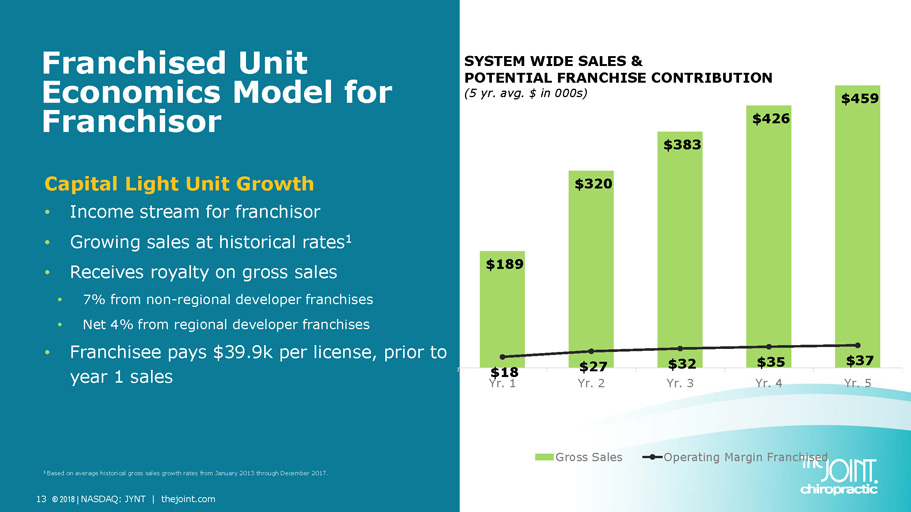
13 © 2018 | NASDAQ: JYNT | thejoint.com Franchised Unit Economics Model for Franchisor Capital Light Unit Growth • Income stream for franchisor • Growing sales at historical rates 1 • Receives royalty on gross sales • 7% from non - regional developer franchises • Net 4% from regional developer franchises • Franchisee pays $39.9k per license, prior to year 1 sales $189 $320 $383 $426 $459 $18 $27 $32 $35 $37 Yr. 1 Yr. 2 Yr. 3 Yr. 4 Yr. 5 SYSTEM WIDE SALES & POTENTIAL FRANCHISE CONTRIBUTION (5 yr. avg. $ in 000s) Gross Sales Operating Margin Franchised 1 Based on average historical gross sales growth rates from January 2013 through December 2017.
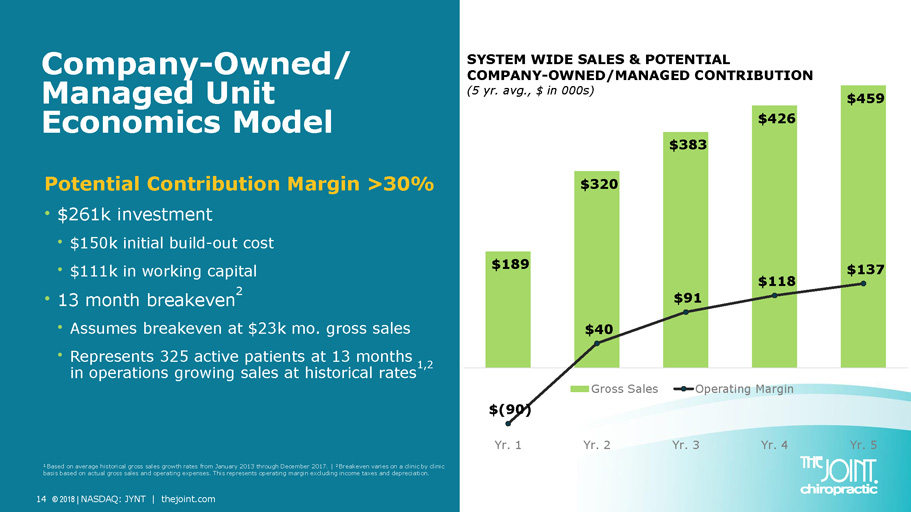
14 © 2018 | NASDAQ: JYNT | thejoint.com Company - Owned/ Managed Unit Economics Model Potential Contribution Margin >30% • $261k investment • $150k initial build - out cost • $111k in working capital • 13 month b reakeven 2 • Assumes breakeven at $23k mo. gross sales • Represents 325 active patients at 13 months in operations growing sales at historical rates 1,2 1 Based on average historical gross sales growth rates from January 2013 through December 2017. | 2 Breakeven varies on a clinic by clinic basis based on actual gross sales and operating expenses. This represents operating margin excluding income taxes and depreci ati on. $189 $320 $383 $426 $459 $(90) $40 $91 $118 $137 Yr. 1 Yr. 2 Yr. 3 Yr. 4 Yr. 5 SYSTEM WIDE SALES & POTENTIAL COMPANY - OWNED/MANAGED CONTRIBUTION (5 yr. avg., $ in 000s) Gross Sales Operating Margin
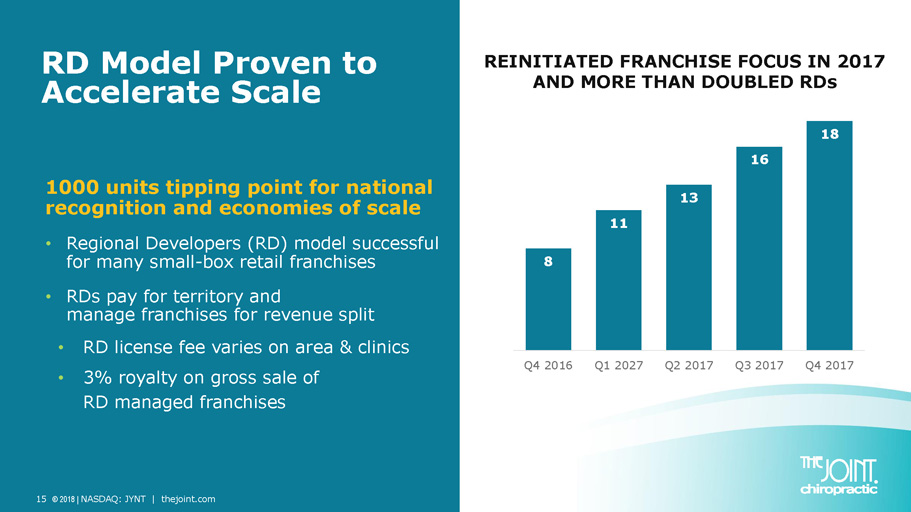
15 © 2018 | NASDAQ: JYNT | thejoint.com 1000 units tipping point for national recognition and economies of scale • Regional Developers (RD) model successful for many small - box retail franchises • RDs pay for territory and manage franchises for revenue split • RD license fee varies on area & clinics • 3% royalty on gross sale of RD managed franchises RD Model Proven to Accelerate Scale REINITIATED FRANCHISE FOCUS IN 2017 AND MORE THAN DOUBLED RDs 8 11 13 16 18 Q4 2016 Q1 2027 Q2 2017 Q3 2017 Q4 2017

Patient Demographic Extremely broad patient base, all walks of life • 25 to 55, M arket Penetration Index ( MPI) of 117 - 174 • Gender s light ly female skew ed , similar to US population • 60% w hite c ollar / 40% b lue c ollar • $50 K - $100 K household income, MPI 146 • Over - index Hispanic and Asian, M PI 162 and 126 • Over - index Bachelor’s degree or higher, MPI 119 • Over - index aerobic exercise, MPI 128 16 © 2018 | NASDAQ: JYNT | thejoint.com The Market Penetration Index (MPI) is a ratio that compares the percent of households in the patient file who possess a speci fic attribute to the percent of households in the reference population who exhibit that same attribute. An index of 100 means that the attribute is found as often within the customer file as it is within the reference population. For example, an MPI of 119 would mean that a specific attrib ute (in this case “Bachelors degree or higher”) showed up 19% more often in our database than it does in the population in which our clinics ex ist .
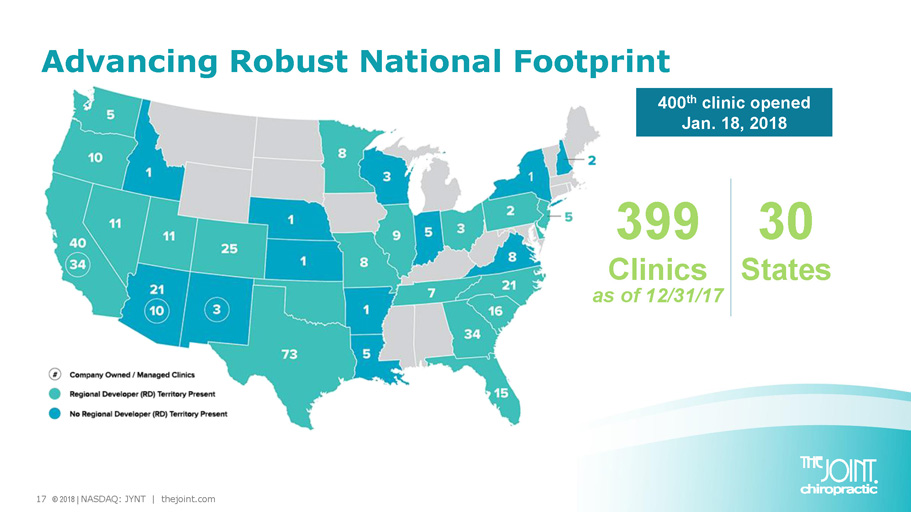
17 © 2018 | NASDAQ: JYNT | thejoint.com 399 Clinics as of 12/31/17 30 States Advancing Robust National Footprint 400 th clinic opened Jan. 18, 2018
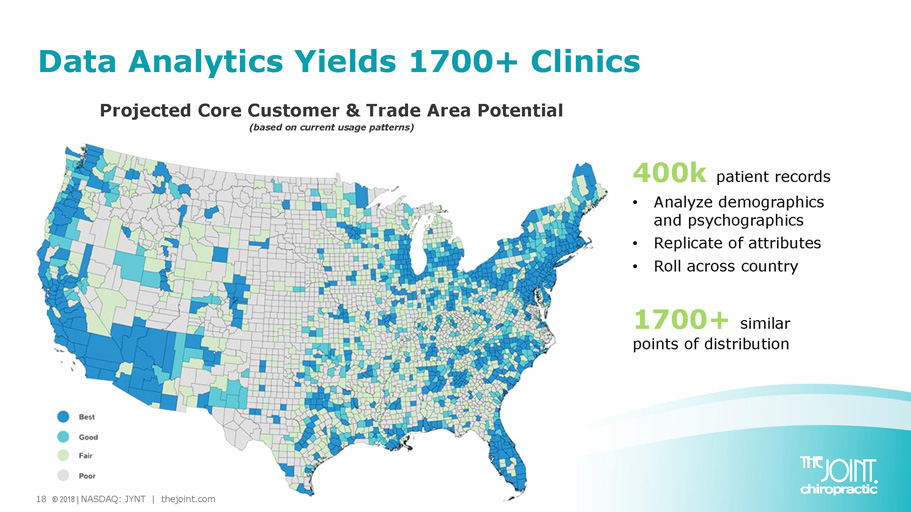
18 © 2018 | NASDAQ: JYNT | thejoint.com 400k patient records • Analyze demographics and psychographics • Replicate of attributes • Roll across country 1700+ similar points of distribution Data Analytics Yields 1700+ Clinics Projected Core Customer & Trade Area Potential (based on current usage patterns)

19 © 2018 | NASDAQ: JYNT | thejoint.com Achi $ in Ms 2017 IMPROVEMENT 2017 vs. 2016 Revenue $25.2 23% Gross profit $21.9 24% G&A $18.5 (28)% Net loss $(3.3) Up $11.9 Adjusted EBITDA 2 $(0.1) Up $7.6, 99% Cash and equivalents at Dec. 31, 2017 $4.2 Up $1.2 Full Year 2017 Metrics 19 © 2018 | NASDAQ: JYNT | thejoint.com • System - wide gross sales up 29% to $126.9M,from $98.6M in 2016 • System - wide comp sales 1 for clinics >13 months in operation increased 21%, compared to 28% in 2016 • System - wide comp sales 1 for clinics >48 months in operation increased 13%, compared to 16% in 2016 1 Comparable Sales include only the sales from clinics that have been open at least 13 or 48 full months and exclude any clinic s t hat have closed. 2 Reconciliation of Adjusted EBITDA to GAAP earnings is included in the Appendix.
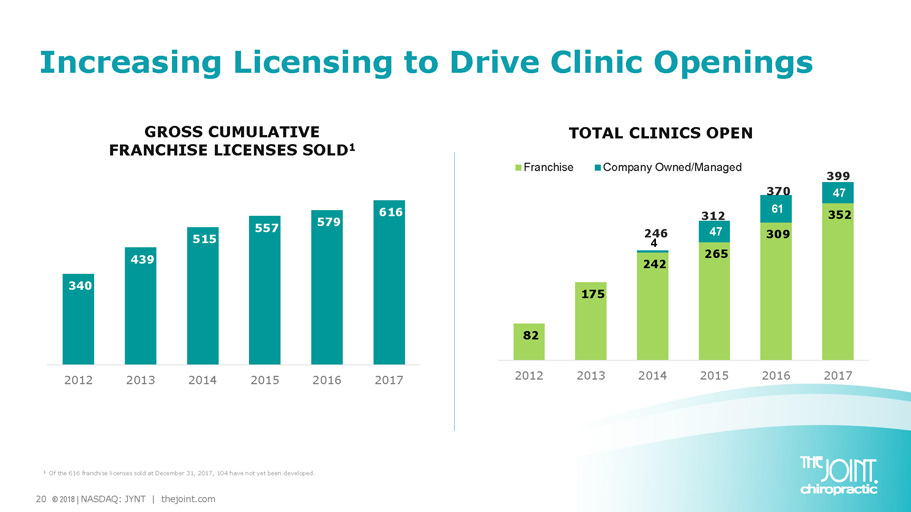
20 © 2018 | NASDAQ: JYNT | thejoint.com 82 175 242 265 309 352 4 47 61 47 2012 2013 2014 2015 2016 2017 Franchise Company Owned/Managed Increasing Licensing to Drive Clinic Openings GROSS CUMULATIVE FRANCHISE LICENSES SOLD 1 TOTAL CLINICS OPEN 312 370 340 439 515 557 579 616 2012 2013 2014 2015 2016 2017 246 399 1 Of the 616 franchise licenses sold at December 31, 2017, 104 have not yet been developed.

21 © 2018 | NASDAQ: JYNT | thejoint.com Driving Top - line Growth SYSTEM - WIDE GROSS SALES ($ in Ms ) $8.1 $22.3 $46.2 $70.1 $98.6 $126.9 2012 2013 2014 2015 2016 2017 $2.8 $6.0 $7.1 $13.8 $20.5 $25.2 2012 2013 2014 2015 2016 2017 REVENUE ($ in Ms )
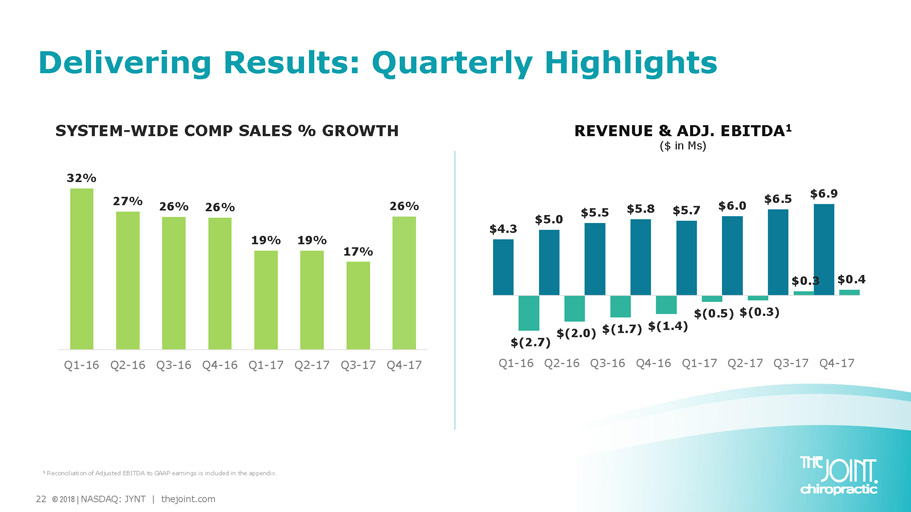
22 © 2018 | NASDAQ: JYNT | thejoint.com Delivering Results: Quarterly Highlights SYSTEM - WIDE COMP SALES % GROWTH REVENUE & ADJ. EBITDA 1 ($ in Ms ) 1 Reconciliation of Adjusted EBITDA to GAAP earnings is included in the appendix. $4.3 $5.0 $5.5 $5.8 $5.7 $6.0 $6.5 $6.9 $(2.7) $(2.0) $(1.7) $(1.4) $(0.5) $(0.3) $0.3 $0.4 Q1-16 Q2-16 Q3-16 Q4-16 Q1-17 Q2-17 Q3-17 Q4-17 32% 27% 26% 26% 19% 19% 17% 26% Q1-16 Q2-16 Q3-16 Q4-16 Q1-17 Q2-17 Q3-17 Q4-17
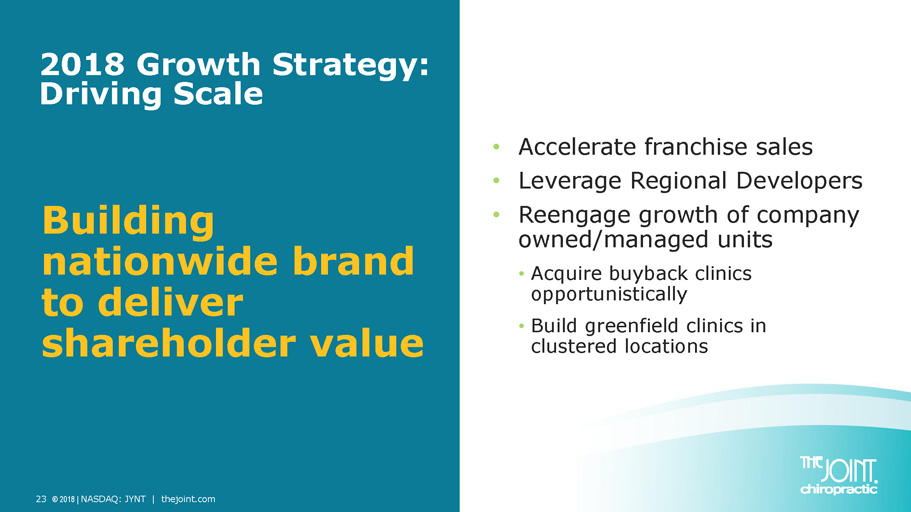
23 © 2018 | NASDAQ: JYNT | thejoint.com 2018 Growth Strategy: Driving Scale • Accelerate franchise sales • Leverage Regional Developers • Reengage growth of company owned/managed units • Acquire buyback clinics opportunistically • Build greenfield clinics in clustered locations Building nationwide brand to deliver shareholder value
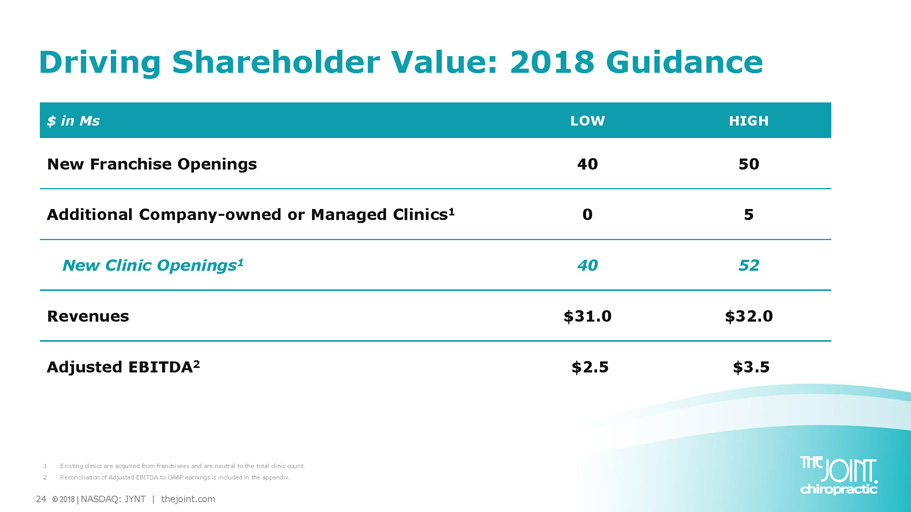
24 © 2018 | NASDAQ: JYNT | thejoint.com $ in Ms LOW HIGH New Franchise Openings 40 50 Additional Company - owned or Managed Clinics 1 0 5 New Clinic Openings 1 40 52 Revenues $31.0 $32.0 Adjusted EBITDA 2 $2.5 $3.5 Driving Shareholder Value: 2018 Guidance 1 Existing clinics are acquired from franchisees and are neutral to the total clinic count. 2 Reconciliation of Adjusted EBITDA to GAAP earnings is included in the appendix.
25 © 2018 | NASDAQ: JYNT | thejoint.com Stable Model, Significant Growth Potential 1 IBIS World Chiropractors Market Research Report; August 2016 • $ 15B growing chiropractic market 1 • Experienced, proven management • 1,700+ clinic national footprint opportunity • 77% 8 - year CAGR in system - wide gross sales • 22% of The Joint patients are new to chiropractic • 76% of revenue from recurring memberships • High returns, self funding growth strategy

APPENDIX
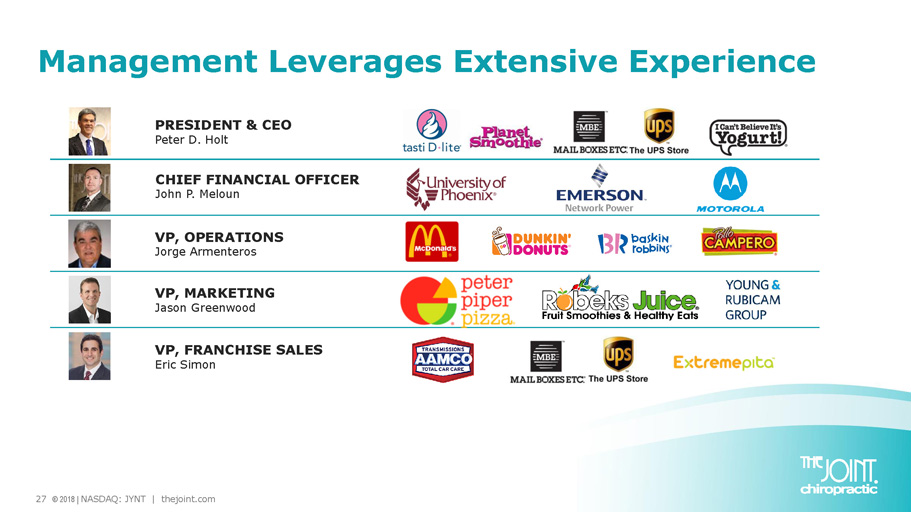
27 © 2018 | NASDAQ: JYNT | thejoint.com PRESIDENT & CEO Peter D. Holt CHIEF FINANCIAL OFFICER John P. Meloun VP, OPERATIONS Jorge Armenteros VP, MARKETING Jason Greenwood VP, FRANCHISE SALES Eric Simon Management Leverages Extensive Experience

28 © 2018 | NASDAQ: JYNT | thejoint.com Matthew E. Rubel Lead Director, 2017 James H. Amos, Jr. Director, 2015 Ronald V. DaVella , CPA Director, 2014 Suzanne M. Decker Director, 2017 Peter D. Holt Director, 2016 Richard A. Kerley Director, 2015 Bret Sanders Director, 2015 • Director, Hudson’s Bay Company & HSNi • Varsity Brands • Collective Brands • Payless • Cole Haan • J. Crew Group • Roark Capital Group, TPG Capital &Growth • Pres. Appointee, House Advisory Council on Trade Policy Negotiation BS, Ohio University MBA, University of Miami • Pres. & CEO, NCPA • Chair, APFI, P &G franchising initiatives • Mail Boxes Etc. now The UPS Store • Chair, International Franchise Association (IFA) • Marine Corps Captain AB, University of Missouri - Columbia • Amazing Lash Studio franchisee • CFO, Amazing Lash Studio Franchise • Deloitte & Touche , rising to Audit Partner BS, Queens College MBA, Pace University • Chief HR Officer, Aspen Dental Mgmt • Davis Vision Companies BS, Russell Sage College • Pres. & CEO, The Joint Corp. • Tasti D - Lite • Great Hills Partners • Mail Boxes, Etc. now UPS Store • Director International Franchise Association (IFA) • Chair, International Affairs Network (IAN) BA, Univ. of Washington MA, University of London • Chair, The Providence Service Corporation (NASDAQ: PRSC ) • Peter Piper, a privately - held pizza & entertainment restaurant chain • Fender Musical • Deloitte & Touche BA, Marshall University • Dir. of Equity Trading, Sanders Morris Harris • R Bank Texas • Ryan - Sanders Baseball, Texas Rangers AAA affiliate • Legal & investment consulting, advising on regulatory & compliance issues • Owner & Dir. Corpus Christi Hooks, Houston Astros AA affiliate BA, University of Houston Experienced Board Offers Leadership
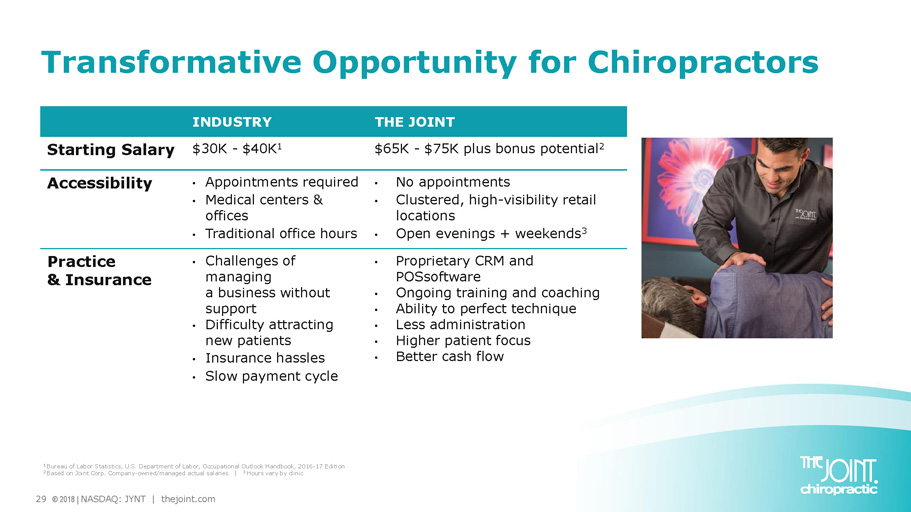
29 © 2018 | NASDAQ: JYNT | thejoint.com INDUSTRY THE JOINT Starting Salary $30K - $40K 1 $65K - $75K plus bonus potential 2 Accessibility • Appointments required • Medical centers & offices • Traditional office hours • No appointments • Clustered, h igh - visibility retail locations • Open evenings + weekends 3 Practice & Insurance • Challenges of managing a business without support • Difficulty attracting new patients • I nsurance hassles • Slow payment cycle • Proprietary CRM and POSsoftware • Ongoing training and coaching • Ability to perfect technique • Less administration • Higher patient focus • Better cash flow 1 Bureau of Labor Statistics, U.S. Department of Labor, Occupational Outlook Handbook, 2016 - 17 Edition 2 Based on Joint Corp. Company - owned/managed actual salaries | 3 Hours vary by clinic Transformative Opportunity for Chiropractors
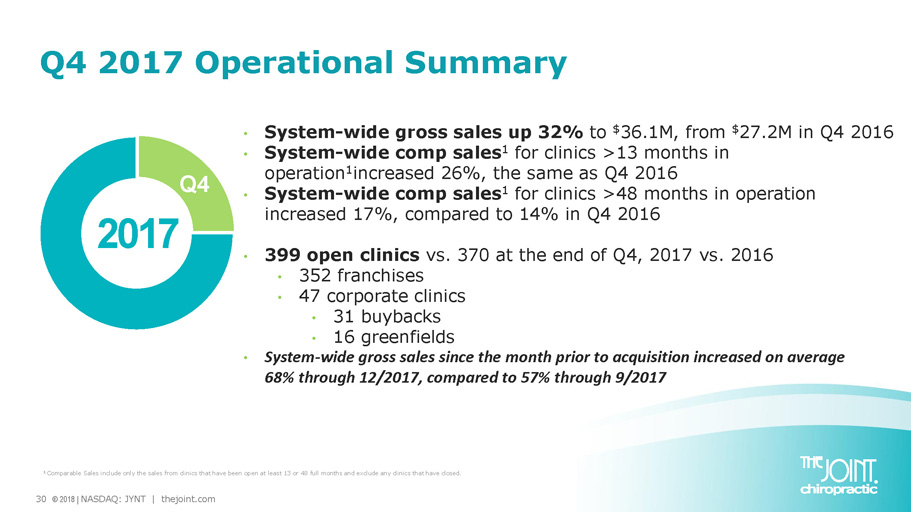
30 © 2018 | NASDAQ: JYNT | thejoint.com Q4 2017 Operational Summary • System - wide gross sales up 32% to $ 36.1M, from $ 27.2M in Q4 2016 • System - wide comp sales 1 for clinics >13 months in operation 1 increased 26%, the same as Q4 2016 • System - wide comp sales 1 for clinics >48 months in operation increased 17%, compared to 14% in Q4 2016 • 399 open clinics vs. 370 at the end of Q4, 2017 vs. 2016 • 352 franchises • 47 corporate clinics • 31 buybacks • 16 greenfields • System - wide gross sales since the month prior to acquisition increased on average 68% through 12/2017, compared to 57% through 9/2017 2017 Q4 1 Comparable Sales include only the sales from clinics that have been open at least 13 or 48 full months and exclude any clinic s t hat have closed.
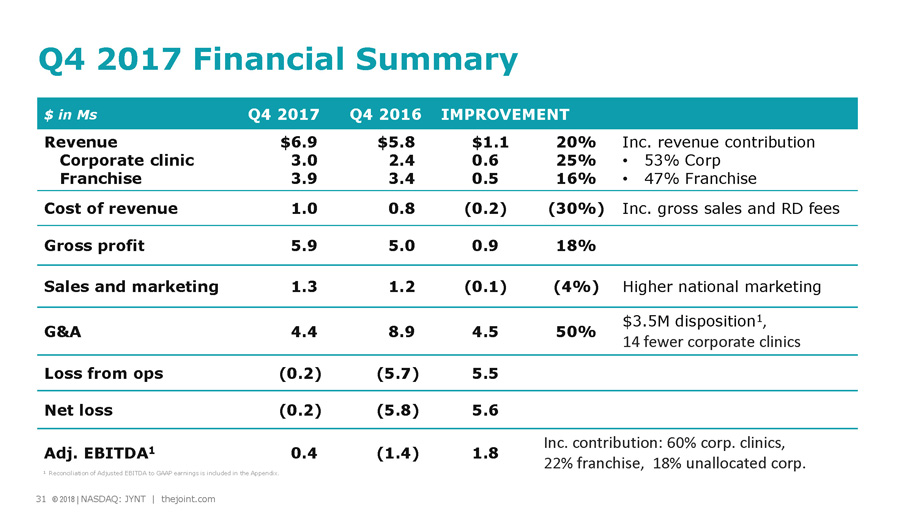
31 © 2018 | NASDAQ: JYNT | thejoint.com Achi $ in Ms Q4 2017 Q4 2016 IMPROVEMENT Revenue Corporate clinic Franchise $6.9 3.0 3.9 $5.8 2.4 3.4 $1.1 0.6 0.5 20% 25% 16% Inc. revenue contribution • 53% Corp • 47% Franchise Cost of revenue 1.0 0.8 (0.2) (30%) Inc. gross sales and RD fees Gross profit 5.9 5.0 0.9 18% Sales and marketing 1.3 1.2 (0.1) (4%) Higher national marketing G&A 4.4 8.9 4.5 50% $3.5M disposition 1 , 14 fewer corporate clinics Loss from ops (0.2) (5.7) 5.5 Net loss (0.2) (5.8) 5.6 Adj. EBITDA 1 0.4 (1.4) 1.8 Inc. contribution: 60% corp. clinics, 22% franchise, 18% unallocated corp. Q4 2017 Financial Summary 31 © 2018 | NASDAQ: JYNT | thejoint.com 1 Reconciliation of Adjusted EBITDA to GAAP earnings is included in the Appendix.
Non - GAAP Measure Definition This presentation includes a presentation of EBITDA and Adjusted EBITDA, which are non - GAAP financial measures. EBITDA and Adjusted EBITDA are presented because they are important measures used by management to assess financial performance, as management believes they provide a more transparent view of the Company’s underlying operating performance and operating trends. Reconciliations of net loss to EBITDA and Adjusted EBITDA are presented where applicable. The Company defines EBITDA as net income (loss) before net interest, taxes, depreciation and amortization expenses. The Company defines Adjusted EBITDA as EBITDA before acquisition - related expenses, bargain purchase gain, loss on disposition or impairment, and stock - based compensation expenses. EBITDA and Adjusted EBITDA do not represent and should not be considered alternatives to net income or cash flows from operations, as determined by accounting principles generally accepted in the United States, or GAAP. While EBITDA and Adjusted EBITDA are frequently used as measures of financial performance and the ability to meet debt service requirements, they are not necessarily comparable to other similarly titled captions of other companies due to potential inconsistencies in the methods of calculation. EBITDA and Adjusted EBITDA should be reviewed in conjunction with the Company’s financial statements filed with the SEC. 32 © 2018 | NASDAQ: JYNT | thejoint.com
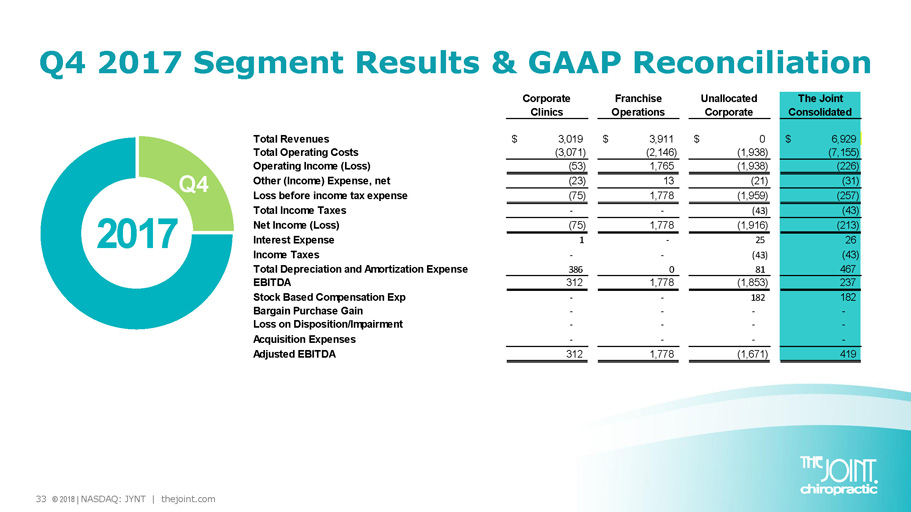
33 © 2018 | NASDAQ: JYNT | thejoint.com Q4 2017 Segment Results & GAAP Reconciliation 2017 Q4 Corporate Clinics Franchise Operations Unallocated Corporate The Joint Consolidated Total Revenues 3,019$ 3,911$ 0$ 6,929$ Total Operating Costs (3,071) (2,146) (1,938) (7,155) Operating Income (Loss) (53) 1,765 (1,938) (226) Other (Income) Expense, net (23) 13 (21) (31) Loss before income tax expense (75) 1,778 (1,959) (257) Total Income Taxes - - (43) (43) Net Income (Loss) (75) 1,778 (1,916) (213) Interest Expense 1 - 25 26 Income Taxes - - (43) (43) Total Depreciation and Amortization Expense 386 0 81 467 EBITDA 312 1,778 (1,853) 237 Stock Based Compensation Exp - - 182 182 Bargain Purchase Gain - - - - Loss on Disposition/Impairment - - - - Acquisition Expenses - - - - Adjusted EBITDA 312 1,778 (1,671) 419
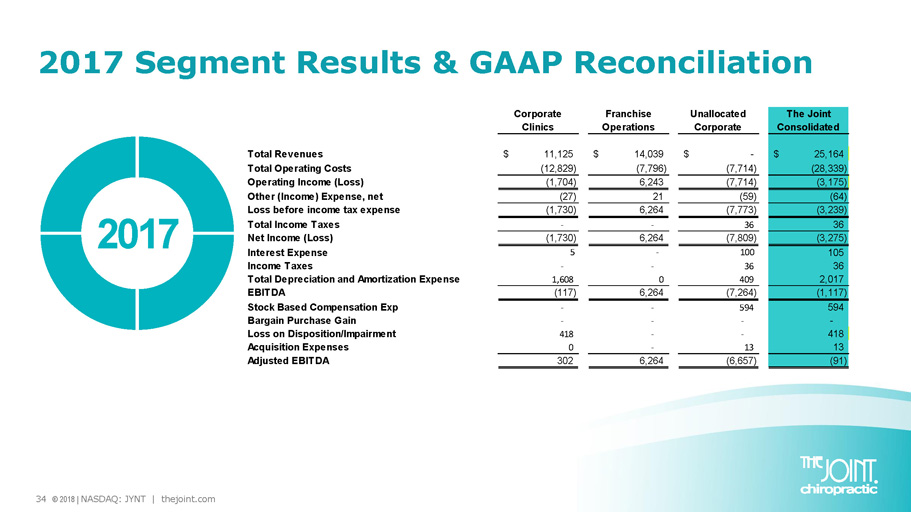
34 © 2018 | NASDAQ: JYNT | thejoint.com 2017 Segment Results & GAAP Reconciliation 2017 Corporate Clinics Franchise Operations Unallocated Corporate The Joint Consolidated Total Revenues 11,125$ 14,039$ -$ 25,164$ Total Operating Costs (12,829) (7,796) (7,714) (28,339) Operating Income (Loss) (1,704) 6,243 (7,714) (3,175) Other (Income) Expense, net (27) 21 (59) (64) Loss before income tax expense (1,730) 6,264 (7,773) (3,239) Total Income Taxes - - 36 36 Net Income (Loss) (1,730) 6,264 (7,809) (3,275) Interest Expense 5 - 100 105 Income Taxes - - 36 36 Total Depreciation and Amortization Expense 1,608 0 409 2,017 EBITDA (117) 6,264 (7,264) (1,117) Stock Based Compensation Exp - - 594 594 Bargain Purchase Gain - - - - Loss on Disposition/Impairment 418 - - 418 Acquisition Expenses 0 - 13 13 Adjusted EBITDA 302 6,264 (6,657) (91)

35 © 2018 | NASDAQ: JYNT | thejoint.com Peter D. Holt, President and CEO peter.holt@thejoint.com John P. Meloun, Chief Financial Officer john.meloun@thejoint.com Kirsten Chapman, LHA Investor Relations thejoint@lhai.com The Joint Corp. | 16767 N. Perimeter Dr., Suite 240 | Scottsdale, AZ 85260 | (480) 245 - 5960 The Joint Corp. Contact Information https://www.facebook.com/thejointchiro @ thejointchiro https://twitter.com/thejointchiro @ thejointchiro https://www.youtube.com/thejointcorp @ thejointcorp